|
The Kynex Convertible model is a robust proprietary
valuation engine designed and built with state of the art techniques using
a finite-difference implicit solver.
The Kynex Convertible Model was built by Sateesh Mane
and John
Loewenstein with a blueprint design from renowned quantitative
analyst, Peter Carr. Sateesh and
John have several years of experience building quantitative analytics in
the financial industry. The Kynex
Convertible Model handles all the known nuances among the various
convertible structures that exist in the convertible market today such as
accreting call prices, cash on conversion, make-whole provisions, etc. in
addition to other advanced features unique to this model. The Kynex model
has gone through rigorous testing over the past several months, and the
valuation metrics are accurate and stable.
Some notable features worth mentioning are
- The bankruptcy model, which
simulates the observed correlation between credit spreads and stock
prices.
- Convertible securities that pay a
floating coupon rate and/or accrete on a floating rate basis.
- Variable conversion ratio, which
is also referred to as convertible securities with embedded warrants by
some market participants.
These features will be described in more detail below.
We intend to incorporate new features that come to the market into the
model in a timely fashion.
Bankruptcy model:
Kynex has created a dynamic bankruptcy model using modern theories to
simulate a convertible security that trades as if the company could go
bankrupt. The model values a
convertible security by imposing a definable correlation between credit
spreads and stock prices i.e. widening spreads as the stock price declines
and vice-versa. We present a brief
description of the bankruptcy model.
The basic valuation partial differential equation is:

Here  is the stock price
and is the stock price
and  is the time to
maturity. The other parameters in the equation are is the time to
maturity. The other parameters in the equation are
- V: fair value of the convertible security
 : volatility : volatility : spot rate : spot rate : continuous proportional dividend yield : continuous proportional dividend yield : convertible credit spread : convertible credit spread : stock credit spread (used to calculate forward
stock prices in the grid) : stock credit spread (used to calculate forward
stock prices in the grid) : reference spot price : reference spot price : “spread decay factor” (= exponent for bankruptcy
spread) : “spread decay factor” (= exponent for bankruptcy
spread) : discrete dividend, paid at time to expiration : discrete dividend, paid at time to expiration   : discrete coupon, paid at time to expiration : discrete coupon, paid at time to expiration 
The terms proportional to and parameterize the
risk of bankruptcy. Here (or) is the credit spread of the convertible (or stock) when
the value of equals the
reference spot price (the current
market spot price). For both the stock and the bond, the
bankruptcy spread has the form

The spread increases to
infinity as the value of decreases to zero.
The value of the exponent determines the
rate of credit deterioration. The graph below shows the typical profile of
the Fair Value, Delta and credit spread used for various stock prices.
As an example, if the assumed spread is 500 bps, input
stock price is 40, and decay factor is 0.5, the spread used inside the grid
by the model for a stock price of 30 would be
500*(40/30)^0.5 = 577.35 bps.
The following grid provides a multiplier that is used to
calculate the effective spread used for various changes in stock price.
|
Stock
|
Spread
Decay Factor
|
|
Change%
|
0.25
|
0.50
|
0.75
|
1.00
|
1.25
|
1.5
|
|
-10
|
1.03
|
1.05
|
1.08
|
1.11
|
1.14
|
1.17
|
|
-20
|
1.06
|
1.12
|
1.18
|
1.25
|
1.32
|
1.40
|
|
-30
|
1.09
|
1.2
|
1.31
|
1.43
|
1.56
|
1.71
|
|
-40
|
1.14
|
1.29
|
1.47
|
1.67
|
1.89
|
2.15
|
|
-50
|
1.19
|
1.41
|
1.68
|
2.00
|
2.38
|
2.83
|
|
-60
|
1.26
|
1.58
|
1.99
|
2.50
|
3.14
|
3.95
|
|
-70
|
1.35
|
1.83
|
2.47
|
3.33
|
4.50
|
6.09
|
|
-80
|
1.50
|
2.24
|
3.34
|
5.00
|
7.48
|
11.18
|
|
-90
|
1.78
|
3.16
|
5.62
|
10.00
|
17.78
|
31.62
|
|
10
|
0.98
|
0.95
|
0.93
|
0.91
|
0.89
|
0.87
|
|
20
|
0.96
|
0.91
|
0.87
|
0.83
|
0.80
|
0.76
|
|
30
|
0.94
|
0.88
|
0.82
|
0.77
|
0.72
|
0.67
|
|
40
|
0.92
|
0.85
|
0.78
|
0.71
|
0.66
|
0.60
|
|
50
|
0.90
|
0.82
|
0.74
|
0.67
|
0.60
|
0.54
|
|
60
|
0.89
|
0.79
|
0.70
|
0.63
|
0.56
|
0.49
|
|
70
|
0.88
|
0.77
|
0.67
|
0.59
|
0.52
|
0.45
|
|
80
|
0.86
|
0.75
|
0.64
|
0.56
|
0.48
|
0.41
|
|
90
|
0.85
|
0.73
|
0.62
|
0.53
|
0.45
|
0.38
|
|
100
|
0.84
|
0.71
|
0.59
|
0.50
|
0.42
|
0.35
|
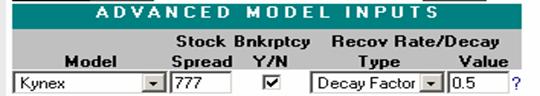
Usage of Bankruptcy Model
In order to turn on the dynamic spread in the model,
please choose Kynex as the model to use and check the Bankruptcy Y/N box.
Turning on the bankruptcy mode allows you to specify two other inputs. The
first input allows you to choose between a Decay Factor or Recovery Rate
specification. If you choose Decay Factor, the second input is the value of
the exponent p described above. In this mode, the convertible fair value
will approach zero as the stock price declines to zero.
If you choose Recovery Rate, the second input is the
expected rate of recovery for the convertible security in the event of
bankruptcy, please input 20 for a 20% recovery rate. The Kynex model will
use an appropriate decay factor such that the fair value will approach the
specified recovery rate at a parity of 1.
Floating Rate Convertible Securities: When
valuing floating rate convertible securities the Kynex model dynamically
generates the future index values from the next reset date, using the
implied forward rates derived from the appropriate benchmark curve. The
Kynex model handles convertible securities that pay a floating rate coupon
(such as Lehman Brothers due 2022, SLM Corp due 2007, etc.) as well as
convertible securities that accrete on a floating basis (such as Merrill
Lynch due 2032). The Kynex model also handles convertible securities that
pay a floating rate coupon to begin with and change to a floating rate
accretion after a few years (such as Wells Fargo, Mandalay
Group, etc.).
One of the challenges in valuing a floating rate
convertible security is the estimation of sensitivity to interest rates, Rho. While estimating the Rho
for a fixed coupon/accreting convertible security, the model only has to
perturb the interest rate curve. In the case of floating rate convertibles,
the model has to re-calibrate the appropriate index-values to be used in
response to the shift in the interest rates. The Kynex model handles the estimation of
Rho correctly for floating rate convertibles.
We would like to point out that valuing floating rate
convertibles based on implied forward rates is likely to under/over
estimate the value of the security, if the actual interest rates in the
future turn out to be different from the market consensus, at the time of
valuation. Please refer to our section on Interest Rate Swaps for more
details on this subject. Our analysis suggests floating rate convertible
securities are more attractive to investors in times of rising interest
rates, and are less attractive in a declining interest rate
environment. Our analysis is based
on a study of two examples of floating rate convertible securities – one in
a declining interest rate environment, and the other in a rising interest
rate environment.
Floating rate convertible securities are perceived to
provide a natural hedge against rising interest rates in the market. We
concur with this perception with two caveats. In a declining interest rate
environment, a fixed coupon convertible will get a significant boost in
valuation due to rising bond floors and gamma, while the valuation of a
floating rate convertible will be adversely affected due to lower expected
future index-values. Convertibles that accrete on a floating rate basis
(e.g. Merrill Lynch due 2032) do not provide as much of a natural hedge
because the only cash flow that is adjusted on a floating basis is the put,
call, and redemption values.
We analyzed the Lehman Brothers floating rate
convertible bond issued in March of 2002 as one of the examples. After the convertible was issued, the
interest rates dropped even though the yield curve was positively sloped at
the time of issuance. The declining slope of the yield curve had an adverse
impact, albeit small on the valuation of the security. As a comparison, we
created a synthetic convertible security with identical terms, but paid a
fixed coupon instead of a floating rate coupon. The fixed coupon was calculated
such that the value of the synthetic fixed coupon security was identical to
that of the Lehman floating rate convertible on the date of issue. As you
can see from the graph below the floating rate convertible lost value as
interest rates declined while the fixed coupon convertible gained value,
disproportionately. The orange line
is the spread between the two-year rate and the three-month rate – a proxy
for the slope of the yield curve.
The second example we took was SLM Corp’s floating rate convertible
bonds due 2007. SLM was issued in
May 2003. After the SLM convertible
came to the market, the interest rates rose, and the floating rate
convertible benefited from the rising slope of the yield curve. As a
comparison, we created a synthetic convertible security with identical
terms but a fixed rate coupon that would give the same fair value on the
date of issue. The orange line on
the graph below is the spread between the four year rate and the three month
rate – a proxy for the slope of the yield curve. As you can see the rising
interest rates severely affects the valuation of the fixed coupon
convertible by lowering the bond floor and gamma, while the floating rate
convertible holds its own and benefits slightly from the increasing slope of
the yield curve.
Convertibles with Variable Conversion Ratio: Since March 2003, the convertible market
absorbed a new structure, where the number of shares the security converts
into increases if the stock price is above a pre-defined threshold, and sometimes
capped at a pre-defined higher level. Convertibles from Mandalay
Group, Wells-Fargo, Affiliated Managers, Lin TV
are some examples of convertibles with variable conversion ratios.
Typically, the threshold above which investors receive more shares is the
conversion price of the security. The formula used to calculate the number
of shares is as follows:
Total Shares = Base Shares + K * ((Stock Price – Conversion Price) / Stock
Price)
where K is a constant defined in the prospectus.
Some securities impose a maximum number of total shares
that investors receive.
While the variable conversion ratio feature allows the
issuer to charge a higher conversion premium at issue, it also introduces
some interesting dynamics to the valuation metrics of the convertible
security. The introduction of an option to receive more shares upon certain
conditions, gives a turbo-charged boost to the Delta, Gamma, Vega, Theta,
and Rho of the convertible security as the stock
price rises. Beyond a certain stock price, the Rho
can in fact become positive i.e. the convertible benefits from rising
interest rates. The introduction of
a cap on the total number of shares causes the delta to rise up to a point
and start declining, i.e. the convertible security will have negative gamma
and negative vega in certain range of stock
prices.
Given the high sensitivity to volatility, we suggest
investors should pay careful attention to the volatility input. Using a
higher than realizable volatility input, will cause significant
over-valuation of the convertible security. Additionally, the higher gamma
comes along with a higher theta, i.e. the value of the option in the
convertible decays faster than a convertible without the variable
conversion ratio feature.
Some market participants view convertible securities
with variable conversion ratios to be a convertible security with the base
shares plus a warrant or a call spread depending on any caps on the total
number of shares. In this scenario, to get the complete valuation, you
would have to value the individual components and add them together by
applying appropriate ratios. The Kynex model values convertibles with
variable conversion ratio by calculating the correct parity at future stock
prices and applying the appropriate boundary conditions. Since the
so-called warrants are not detachable and cannot be traded independently,
we believe our methodology is more appropriate. Numerically, the values
from both methodologies will be identical for the same set of assumptions. The
Kynex model currently uses a single volatility assumption. We intend to
provide for a volatility surface assumption in the future.
For our analysis, we took the convertible security
issued by Lin TV in May 2003 which has the variable conversion ratio feature
with a cap. As a comparison, we
created a synthetic convertible that had the same coupon, fixed conversion
ratio, and a lower conversion premium at issue which gives the same fair
value on the issue date. We present
the various comparison charts below.
|