|
The financial markets have witnessed an explosive growth
in Credit Default Swaps (CDS) over the past few years. The simplest CDS is
essentially an insurance policy against a future credit event, usually
defined as bankruptcy or a failure to pay interest or principal on a debt
security (the reference entity). The
buyer of the vanilla CDS pays periodic (usually quarterly) deal payments to
the seller at the end of every period until the sooner of maturity or
default. If default occurs, the
buyer surrenders the defaulted security to the seller and pays a final
accrual payment. The seller of the
CDS pays nothing to the buyer until default. If default occurs, the seller
is obligated to pay the full notional amount of the swap to the buyer.
The financial literature describes two basic kinds of
models to value CDSs. Structural models start with a company’s
fundamentals, and they are derived from the suggestion by Fischer Black,
Myron Scholes and Robert Merton in their 1973 articles on option pricing
that corporate securities can be valued by the same methods as options.
Structural models, such as CreditGrades™, are attractive because they
provide some insight into the default profile of a particular credit. At
their best, these models are designed to distinguish those firms about to
default or deteriorate from those that are healthy. They are unattractive
because valuations can deviate from those of the actual credit market.
Reduced form models start with actual market debt prices and extract the
default profile implied by those prices. It is assumed that all the market
knows about a particular credit is already contained in the market price.
However, these models do not attempt to explain “why”. Reduced form models
show what “is”, and they accurately show the default implications of
assuming a particular credit spread. The Kynex proprietary CDS Model is a
reduced form model, and the worthiness of one model type over the other
goes far beyond the scope of this article (the JP Morgan Model implemented
on Bloomberg™ is also a reduced form model).
John Hull and Alan White, in their 2000 paper
("Valuing Credit Default Swaps I", University
of Toronto, April 2000), show the CDS spread to be the value that equates the
present value of the expected payoffs with the present value of the
expected deal payments. All discounting is done with interest and
probability of default. Rather than
attempting to determine default and recovery rates directly by sifting
through large volumes of default data (this is the credit agency approach,
e.g. Moody's Investors Service monthly default report), the Hull-White
paper suggests a method of calculating the implied default and recovery
rates from market prices and credit spreads. Default probabilities
measure the frequency of defaults, while recovery rates measure default
severity. The entire spread is assumed to be compensation for purchasing a
risky security (i.e. the liquidity spread is zero), and credit spreads,
default probabilities and recovery rates are linked by the default probability
model. Kynex has implemented a Yield
Spread Model (YSM) and a Present Value Cost of Defaults Model (PVCDM). The PVCDM generates default rates
reflecting the actual term structure of credit spreads, and this model is
really more appropriately used when one is interested in generating CDS
spreads from credit spreads. The YSM (the model most often used in the
market place) is probably more appropriate when a constant credit spread
(rather than a term structure of credit spreads) or a constant CDS spread is
specified. More often than not, our
clients get a constant CDS quote from their brokers to mark their position.
The YSM defines the relationship between risky rates, risk-free rates,
default probabilities and recovery rates in the following way:
Yield Spread
Model
  , where , where
 the probability of not defaulting (survival)
between the probability of not defaulting (survival)
between
settlement
(time 0) and time n in the future
 the recovery rate the recovery rate
 the risky yield at time n the risky yield at time n
 the risk-free yield at time n the risk-free yield at time n
Note that the cumulative probability of default is
defined as . Given that
spreads are positive, the cumulative probability of default constantly
increases. If spreads and recovery
rates are constant, the force of default will also be constant. . Given that
spreads are positive, the cumulative probability of default constantly
increases. If spreads and recovery
rates are constant, the force of default will also be constant.
Although numerically close in value (according to
theory), CDS spreads and credit spreads are really quite different fundamentally. Kynex shows the credit spreads
corresponding to a constant CDS spread on its main
output screen. Although
usually close in value, actual market credit spreads can deviate from
market CDS spreads. Please refer to
the chart below which compares CDS spreads and credit spreads for some well
known, liquid credits on 4/22/2004.
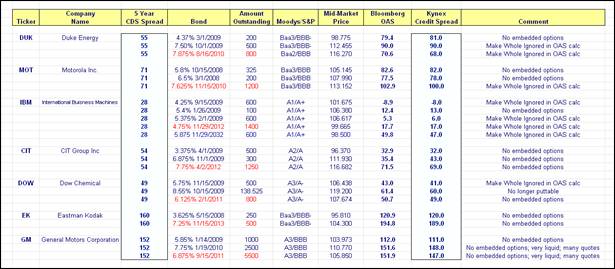
Probabilities of default and recovery rates are the
prime determinants of CDS spreads, while credit spreads are influenced by additional factors such as the
existence of embedded options, time to maturity, difference between the
bond coupon and the currently offered coupon on new issues of similar
bonds, liquidity and tax treatment.
Generally speaking, a bond with embedded options will trade wider
than a similar bond without contingent flows (even on an OAS basis). Because of price compression, a bond
trading at a high premium usually will trade at a wider spread than one
with a coupon closer to currently issued bonds (e.g.MOT 7.625% 11/15/2010
and DOW 8.55% 10/15/2009). Given the
shape of the yield curve, one would expect longer securities to trade wider
than shorter ones (e.g. IBM 5.875% 11/29/2032).
Although CDS spreads may give an initial idea of where credit spreads are, one should not blindly assume that the
credit spread is identical to the CDS spread (the unusually tight
spreads on the IBM bonds maturing in 2009 truly existed on 4/22/2004, and
were caused by demand issues rather than fundamentals). In a 2003 paper by Francis Longstaff,
Sanjay Mithal and Eric Neis (“The Credit Default Swap Market: Is Credit
Protection Priced Correctly?”), the authors suggest that the CDS market
leads the corporate bond market by at least a week. They go on to suggest that the CDS market
even appeared to precede the equity market for a sizeable fraction of the
firms in their sample.
The CDS market has grown dramatically in size and
complexity. According to the ISDA,
the notional amount on credit derivatives reached $2.69 trillion by the
middle of 2003 (as compared to an outstanding volume of $123.9 trillion for
vanilla interest rate derivatives).
That is up 25% since the end of 2002, and it is the fastest growing
sector of the derivatives market.
The complexity of CDSs has grown because of financial (e.g.
diversification) and regulatory (e.g.
capital adequacy requirements) considerations. Once again, the
proliferation of various types of credit derivatives goes far beyond the
scope of this paper, but it is important to note the marriage of credit derivatives
with securitization. The credit risk in a portfolio can be bundled (into a
basket), tranched (using a Collateralized Debt Obligation) and sold in the
capital markets like any other security. CDO tranches can have vastly
different risk characteristics than their underlying assets (which might
also include single name or basket CDSs).
Valuation Model Comparison
It is instructive to use an outstanding CDS in the
market to evaluate the Kynex proprietary model. The following chart uses a
$10 million notional iBoxx High Yield CDS with a 425 deal spread and
maturing on 3/20/09. The chart shows
the principal values resulting from sweeping the market CDS spread from 150
to 750. The columns labeled
“BB-JPM”, “BB-DS” and “BB-HW” show the values corresponding to the
Bloomberg™ implementation of the JP Morgan model, the Discounted Spreads
model and the Hull-White model, respectively.
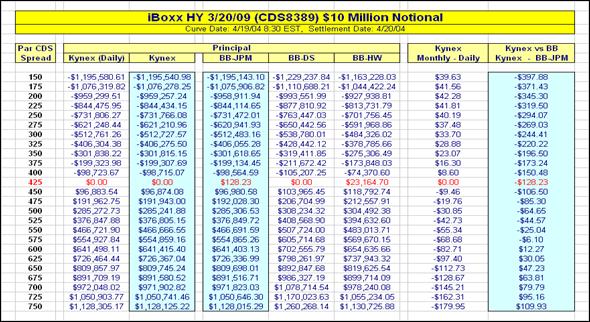
The column labeled “Kynex (Daily)” shows what we believe
to be the most accurate values.
These values are calculated by evaluating the expected payoff
integrals on a daily basis. The
amount of CPU time required forbids us from making this option available on
our calculator screen. Instead, expected
payoffs are evaluated monthly, and then adjusted to approximate the daily
values. These values are shown in the column labeled “Kynex”, and the
difference between the monthly and the daily values are shown in the next
to last column. The Bloomberg™ JP
Morgan model is probably the most widely used model in the marketplace, and
differences from that model and the Kynex model are shown in the last
column. Apparently, Bloomberg’s JP
Morgan model seems to have a small problem, which can be seen when the
iBoxx CDS is valued at the current deal spread of 425. Both models give good valuations.
Recent Model Enhancements
The Kynex model was first released in December of
2002. Recently, the model and its
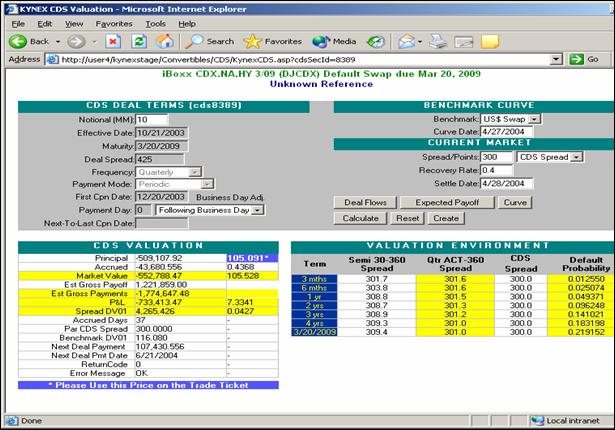
corresponding valuation screen have been updated. In addition to the main screen, Kynex
also shows the deal payments and
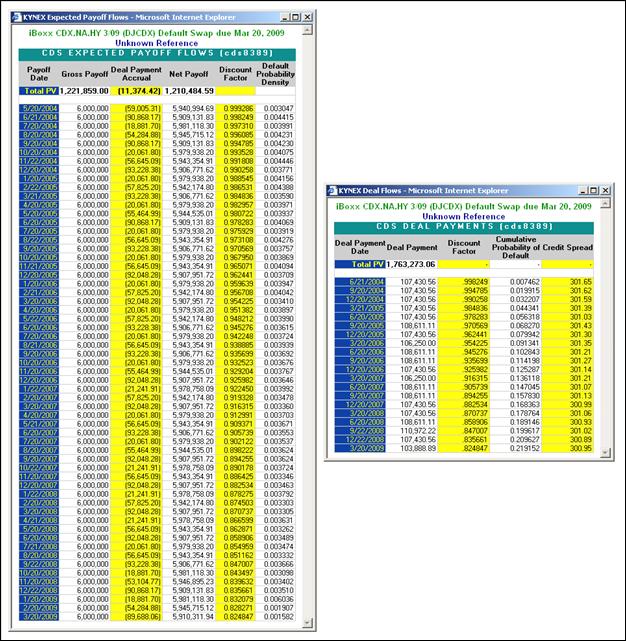
the expected payoffs in separate windows.
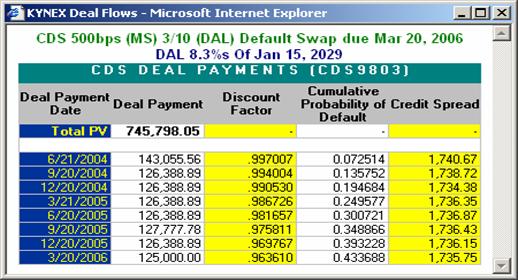
The deal payments screen shows the value and timing of
every future payment from settlement. Additionally, the first line shows
the total expected value of the future payments on settlement discounted
with interest and default assuming that all deal payments are made. The
expected payoff flows include the regular payoff due at default plus the
accrued interest on the deal payment.
The gross deal payments total present value includes this extra
accrual piece (1,774,647.48 = 1,763,273.06 +
11,374.42). On the expected
payoff flows window, the column labeled “Default Probability Density” shows
the probability of not defaulting (survival) from settlement to the prior
payoff date shown, and then defaulting before the current date. For example, the probability of surviving
from 4/28/2004 until 6/21/2004 and then defaulting before 7/20/2004 is
0.003991 as shown below.
On the main input and valuation window, fields now exist
to accommodate odd first and last deal payments as well as business day
adjustments. All dates should be entered unadjusted for business days. If the CDS requires business day
adjustments, the model will adjust the dates. The “Payment Day” field
(usually the day of the unadjusted first deal payment date) is crucial to
maintaining the cycle of the CDS payments. If these values are not
specified, the model will make assumptions which may or may not be
appropriate depending upon the specific CDS contract. When creating single
name CDSs with the “Create” button, it is easier to first go to the Kynex
Detail Screen and click on the “CDS Valuation” link. We also suggest you enter all of the
necessary terms and do a calculation before clicking on the “Create”
button. The terms on the creation
page will automatically be filled in, thus reducing input errors. It should be noted that all iBoxx CDSs
are already in Kynex. There is no
need to enter them again. If you wish to see a list of all the iBoxx’s,
just do a search on “CDX” from the Kynex search box. If you know the Bloomberg™ deal number,
that value can be placed in the search box for immediate access. If you want to identify the counterparty,
just click on “Trade History View” from your portfolio. Currently, Kynex
portfolios and Trade Entry administer long protection as being short the
credit. CDSs should be marked in bond price terms in Trade Entry. However,
existing CDSs in portfolios must be marked by placing the market CDS spread
in the “Convert Price” or the “Convert Anchor” column (depending upon the
view). For those clients using Kynex Trade Entry, your ticket price is
always high-lighted in blue on the valuation screen. As a reminder, if you are long
protection, the Trade Entry ticket should be “sell short”. If you bought a
$10 million notional CDS, the quantity should be 10,000 (like a bond). If you sold protection, the Trade Entry
should be “buy long”. At unwind, the
ticket should be a “buy cover” if long protection, and “sell long” if short
protection.
As the liquidity of the CDS market grows, more of our
clients are buying and selling existing CDSs. This means that the deal spread is
usually not equal to the market CDS spread, thus requiring an upfront
payment. Rather than being quoted on
a CDS spread basis, some of our clients get quotes based on upfront bond
points. The updated CDS calculator
now accommodates these quotes. Please refer to the screens below.
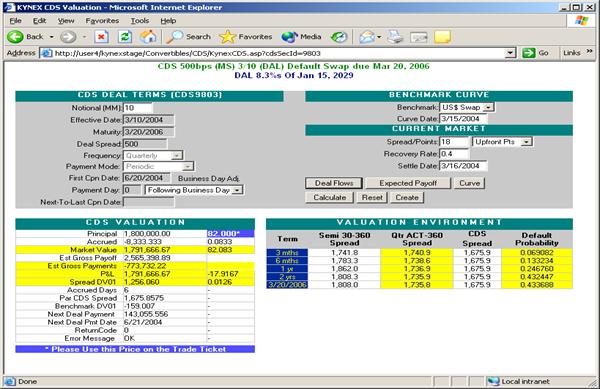
Suppose you sell $10 million notional, two year
protection on DAL 8.3% 1/15/2029, and the terms are quoted as 18 points
plus 500 running. The seller then collects $1,791.666.67 ($1,800,000 less
accrued) upfront plus the future deal payments. The equivalent CDS spread
is 1675.8575. iBoxx CDSs can also be
quoted as a short bond price, and these quotes can be directly entered into
the Kynex valuation screen by choosing “Sh Bond Px” next to the
“Spread/Points” input field. Upfront
points are the complement of the short bond price.
Investment grade names are no longer the only candidates
for CDS protection. As a credit
nears bankruptcy, the credit spread will balloon. If the term of the CDS is long enough and
the market spread is high enough, the cumulative probability of default
will approach certainty. If the spread is extraordinarily high, Kynex will
terminate the CDS before maturity at the point where the cumulative default
probability reaches one. Please refer to the screen immediately below.
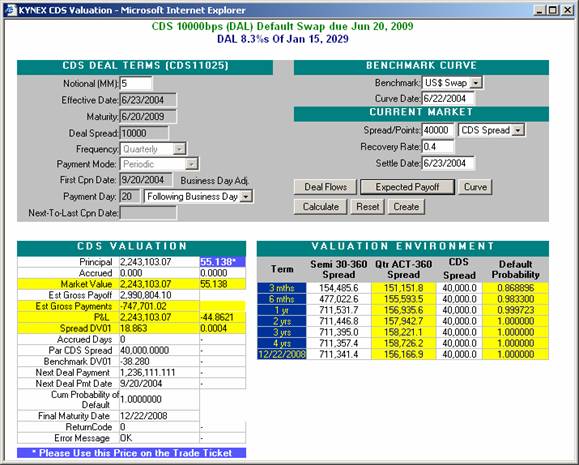
At a market spread of 40000, the default is certain by
12/22/2008. Please note that the recovery rate should not be lowered
artificially. Theoretically at least, the frequency and severity of default
are independent. Please note that this functionality should not be used to
evaluate those CDO tranches (especially the equity piece) that absorb a
disproportionate amount of asset loss.
Reduced form models are intended to identify the default profile of
a credit. Evaluating a CDO equity tranche with this tool says nothing about
the underlying default performance of its assets or the trust structural
definitions and rules. Kynex does not currently have a structuring tool to
properly front-end these kinds of securities.
Another significant enhancement to the Kynex model is
how single premium CDSs are evaluated. Most market participants currently
use a periodic payment calculator for both single risky and single
risk-free contracts. For single
risky contracts, the market value is defined as the gross payoff of the
corresponding periodic payment CDS.
For single risk-free contracts, the valuation becomes more
convoluted. In addition to the
regular payoff of the periodic payment CDS, the buyer of the single
risk-free contract is entitled to a refund calculated as the present value
of the future deal payments. These refunded deal payments are based on the
original deal spread, and they are discounted without taking into
consideration the probability of default (discounted with interest only).
The initial single premium is calculated as the present value of the deal
payments of the corresponding periodic payment CDS. In order to value the single risk-free
unwind, market participants enter a 0 as the market CDS spread, and the
current CDS spread for a periodic payment CDS is entered as the deal spread
(the Bloomberg™ CDS calculator will not take a zero market spread, so
market participants place a one in the market spread and one plus the
current spread in the deal spread).
Kynex has rejected this methodology.
Instead, we have gone back to first principles by evaluating the
true expected default payoffs in the future.
Our main reason for taking this approach is to correctly
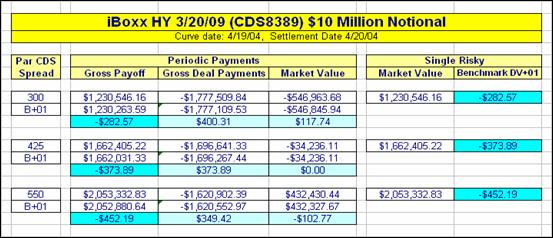
identify the risk characteristics of the single premium CDS. For purposes of illustration, assume that
the iBoxx High Yield CDS mentioned above has been sold on a single risky
basis. Please refer to the chart
below.
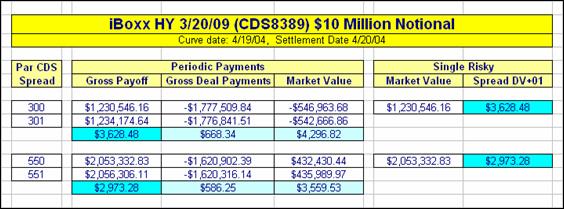
Both the periodic payment and the single risky contracts
were valued at a 300 and a 550 spread. As you can see, the Spread DV+01 of
the periodic payment CDS is not equal to that of the single premium. At
300, the periodic payment CDS has a total Spread DV+01 of $4,297, while the
single risky contract has a DV+01 of $3,628. Since
deal payments are not being made, the single risky has a smaller Spread
DV+01. Market participants think
of the CDS Benchmark DV+01 as being almost zero. For periodic payments CDSs, this rule of
thumb is accurate. It is less
accurate for single premium CDSs.
The chart shown below compares the Benchmark DV+01 of the same CDS
used above on both a periodic payment and single risky basis.
During our evaluation of the single risk-free contract,
we also noticed an inconsistency in how that contract is defined. The additional refund at default is
calculated on the basis of the initial deal spread, while the unwind is
calculated on the basis of the current market spread. This disconnect results in improper
unwind values as currently defined by the market.
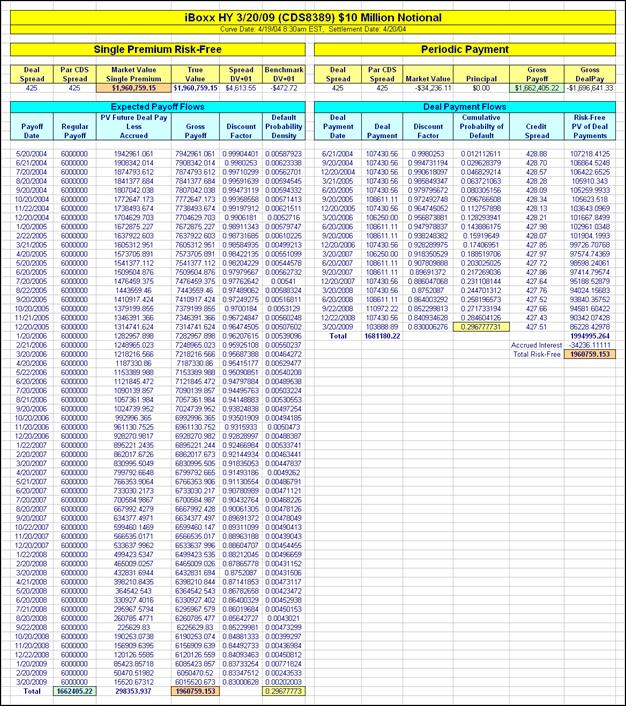
It is instructive to view the expected payoff flows when
the current spread is equal to the original deal spread of 425. Please see the first
table below in which the single premium risk-free expected
payoff flows are compared to the equivalent periodic payment deal payment
flows when the market CDS spread is 425.
As expected, the single premium (market value) of the single
risk-free CDS is equal to the risk-free present value of the periodic
payment deal payments. Note also
that the single risk-free single premium is equal to the discounted (with
interest and default) gross payoff. When the market spread is equal to the
deal spread, the true value is identical to the single premium.
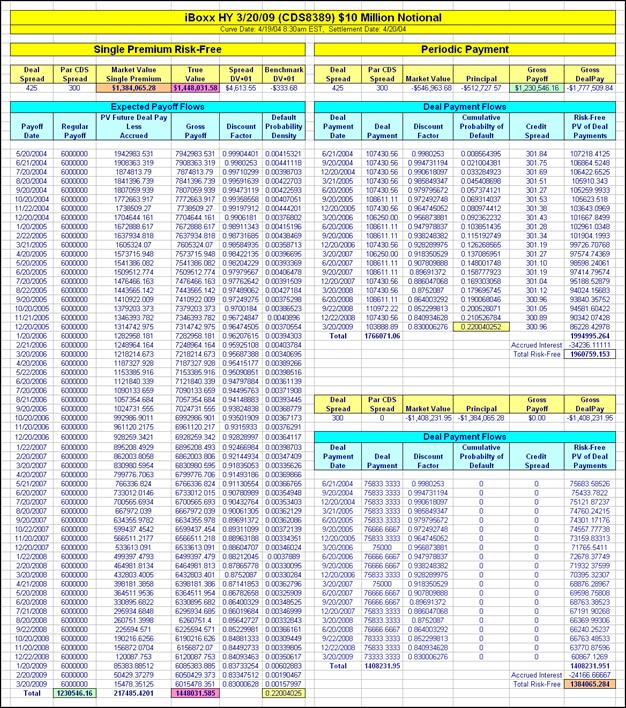
However, if the single risky CDS is valued at a 300 CDS
spread, then the true value diverges from the unwind single premium as
currently calculated in the marketplace.
Please see the second table
below in which the flows are evaluated at a market CDS spread of 300. Note that
the single risk-free true value is still equal to the discounted (with
interest and default) gross payoff.
Note that the risk-free gross payoff values at every future date are
identical (except for a small adjustment used to approximate daily payoffs)
regardless of the market CDS spread. However, the single premium is now
erroneously based upon deal payments of a 300 spread. In this case, the true value exceeds the
single premium by $63,966. The
seller would pick this up at unwind.
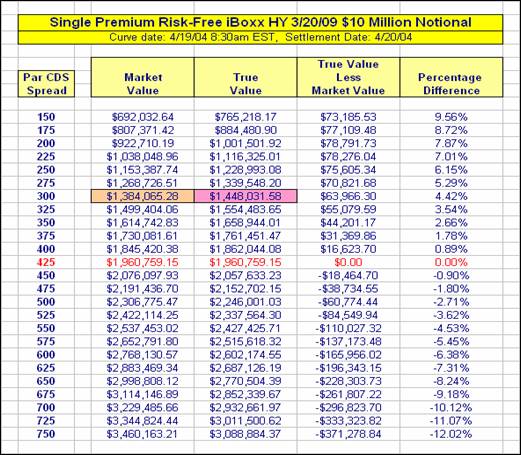
But this inconsistency cuts both ways. In the last
table found below, we quantify the difference between the market
value and the true value by once again sweeping the market CDS spread from
150 to 750. At a 300 market spread,
the seller picks up 4.42% of the true value, but at 500 he gives up 2.71%. Our conclusion is that the single
risk-free contract as it is currently administered is stacked in favor of
the seller. If the credit in
question improves, so that the buyer is more likely to unwind, the seller
gains from the unwind. If the credit
deteriorates, the seller will be hit with more of a loss if an unwind
occurs. However, the buyer would not
have the incentive to unwind under that scenario.
|