|
The convertible hedge calculator allows you to analyze a
convertible security that is hedged with the underlying common stock. You can
dynamically change the amount of hedge, convertible and stock prices,
assumptions such as financing and rebate rates, carry horizon, and margin
requirements, etc. and analyze the expected static (assuming convertible
and stock prices do not change) as well as realistic (estimating the
accretion/decay in the value of the convertible over the holding period)
cash flows, and hence the expected return on capital deployed.
The convertible hedge calculator also estimates the
weekly profit-and-loss in excess of the realistic return, required to
generate a target return on capital. In addition you can also analyze
rule-of-thumb calculations used by market participants such as
breakeven-at-par (also referred to as crosses-par) and breakeven-at-parity
(also referred to as up-breakeven). Last but not the least, valuation
measures such as fair value, delta, gamma, yields, premium; convertible
indicative information such as conversion ratio, call, put, outstanding
amount, ratings, issue terms; stock indicative information such as 90-day
and 250-day volatility, distance from 52-week high and low, economic
sector, market capitalization are also presented along side the cash flows
and hedge-breakeven levels.
The convertible
hedge calculator is presented in two sections:
·
The upper section allows you to specify the
inputs and assumptions.
·
The lower section shows the results from the
calculations.
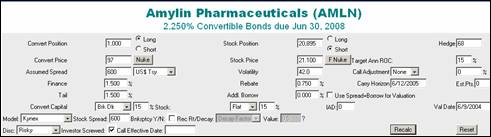
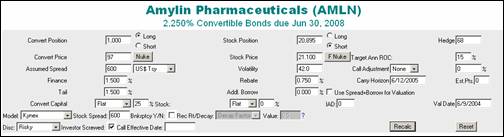
The upper section has been laid out such that your
inputs for the convertible and the stock are grouped in a logical fashion for
ease of entry. The table below
explains the input to the convertible hedge calculator.
|
Input
|
Definition
|
|
Convert Position
|
The number of Convertibles you
own long or short.
|
|
Convert Price
|
The price of the Convertible
|
|
Assumed Spread
|
The credit spread of the bond
over the chosen Yield Curve
|
|
Finance
|
The percentage rate that your
prime broker charges to finance the convertible position
|
|
Tail
|
The Tail is applicable if the broker
charges a different rate on the point premium. For example the broker
charges a 1.5% finance charge on the parity of the convertible position
and a .75% on the balance or point premium. If the broker charges one rate then the
Finance and Tail should be the same.
|
|
Convert Capital
|
The agreement between you and
your broker to calculate margin requirements. Please click
here to see the Rules.
|
|
Stock Spread
|
You can specify the spread to
grow the stock in the finite difference grid. Input the same value as the assumed
spread to value the convertible
risky/risky (recommended), 0 for risk-free risky, or something
else for a custom setting
|
|
Bankruptcy
|
Enable the bankruptcy model to simulate
risk-of-default for a convertible.
|
|
Investor Screwed
|
This flag tells the convertible
valuation model if the investor will receive a coupon payment if the bond
has been called for redemption effective on the interest payment
date. If the box is checked it
indicates to the model that the investor is getting screwed out of the
coupon and will not receive the interest payment. If the box is unchecked the investor
will receive the interest payment if the convertible is called for
redemption and the investor is forced to convert
on the interest payment date
|
|
Call Effective Date
|
If a bond is called, this is the
date on which the call is effective. This box will not be filled for partial
redemptions. You can use this input to value convertibles that you expect
to be cash-called for redemption.
|
|
Stock Position
|
The number of shares you are long
or short.
|
|
Stock Price
|
The price of the common stock.
|
|
Nuke
|
Pops up a new window to calculate
the dollar neutral price. If you
hit the “OK” button it will put the dollar neutral price in the hedge
calculator.
|
|
F Nuke
|
This nuke is a quick way to
calculate a dollar neutral price. If you have a convert price and stock
price in the hedge calculator, and hit “calculate” you can just change
the stock price and get the new dollar neutral price. The F Nuke takes the previous stock and
convert price as reference prices and then takes the new stock price and
hedge to calculate the dollar neutral price.
|
|
Volatility
|
Your volatility estimate for the
common stock
|
|
Rebate
|
The rate used to calculate the
rebate on your short-sale proceeds.
|
|
Additional Borrow
|
You can specify an additional borrow
cost for tough to borrow stocks. This will be netted out of the rebate.
|
|
Hedge
|
Fill in your hedge and the
calculator will automatically update your stock position. Changing the
stock position will update the hedge, as well.
|
|
Target Ann ROC
|
Your target annualized return on
capital
|
|
Call Adjustment
|
Setting the call adjustment to
Parity+ and putting a number of 20 will make the model value the
convertible such that the issuer cannot call the convertible until the
parity is at least 20% above the call price. NCL stands for Non Call Life.
|
|
Carry Horizon
|
Your investment horizon
|
|
Est. Pts.
|
Your estimate of point premium at
which the convertible is likely to trade on the horizon date
|
|
Use Spread + Borrow
|
If this is checked the valuation
model will use the spread of the finance and rebate plus the borrow cost,
as an additional cost that increases with delta. If left unchecked, the
model will not take these inputs into account.
|
|
IAD
|
Indicated Annual Dividend. The
page will default to the current indicated annual dividend. You may
change this to simulate dividend increases/decreases. If you want to make the IAD from .5 to
0 you must put in .0001. By convention if the IAD is zero the valuation
model will pick up the value stored in our database.
|
|
Val Date
|
The trade date you want to
analyze your hedge
|
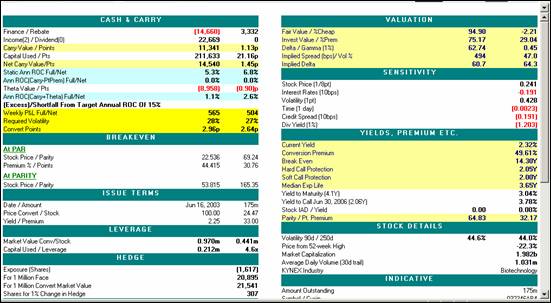
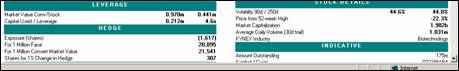
The lower part of the screen presents the results of our
calculations - cash-flows and hedge-breakeven (left side) and theoretical
valuation and indicative information (right side). We present below a table
explaining each output from the convertible hedge calculator, followed by a
more detailed explanation of some of the results.
|
Cash & Carry Outputs
|
Definition
|
|
Finance
|
This is the cost of financing the
convertible position at the current price using the financing rate over
the carry horizon. Finance = Finance
Rate X Convert Position X Convert Price X Horizon. Example:
14660 = .015 X 1000 X (970) X
1.00756
|
|
Rebate
|
This is the rebate on the short
stock position using the rebate rate over the carry horizon. Rebate =
Rebate Rate X Stock Position X Stock Price X Horizon. Example: 3,332= .0075 X 20,985 X 21.1 X 1.00756
|
|
Income
|
The Income is the sum of the
coupon payments received from the long convert position over the carry
horizon net of accrued interest.
|
|
Dividends
|
The Dividends is the sum of the
dividends paid out on the short stock position over the carry horizon
|
|
Carry Value
|
This is the sum of the Finance,
Rebate, Income, and Dividends.
Carry
Value = (Finance) + Rebate + Income + (Dividends)
11,341=(14,660)
+ 3,332 + 22,669 + 0
|
|
Capital Used
|
This is the
estimated capital in dollars using the capital rules and rates.
|
|
Net Carry Value
|
This is the Carry in dollars if
one assumes Capital is free.
Net Carry Value = Carry Value + [Capital
Used X Finance X Horizon]
14,540= 11,341 + (211,633 X .015
X 1.00756)
|
|
Static Ann ROC
|
Static Ann ROC full is the
annualized return on capital assuming that the capital cost is the same
as Finance cost. Static Ann ROC net is assuming capital is free.
|
|
Ann ROC(Carry-PtPrem)
|
Annualized Return on Capital if
the convertible trades at input point premium on the horizon date. Full is assuming cost of capital same
as finance rate and Net is assuming cost of capital is zero.
|
|
Theta Value
|
Theta Value is the estimated
decay/acceleration in the value of the convertible over the carry horizon
in dollars. See
Commentary below for more details.
|
|
Ann ROC(Carry+Theta)
|
Ann ROC(Carry + Theta) is the annualized
return on capital including the estimated decay/acceleration in the value
of the convertible over the carry horizon.
|
|
Weekly P&L
|
Weekly P&L Full is the
estimated weekly P&L after the Carry + Theta on the position to meet the
target ROC assuming cost of Capital is the same as financing rate. The Weekly P&L Net is the estimated
weekly P&L after the Carry + Theta on the position to meet the target
ROC assuming the cost of Capital is zero.
|
|
Required Volatility
|
Volatility need to be realized
from gamma trading after the Carry + Theta on the position to meet the
target ROC. See below for
commentary.
|
|
Convert Points
|
The convertible needs to richen
by this many points over the carry horizon to meet the target ROC after
Carry + Theta on the position.
|
|
Exp. Gamma P&L
|
Potential gamma P&L if
assumed volatility is realized. P&L = Position * Gamma1% *
(Conversion Ratio / Fx) * Stock Price * 0.5 *
(VolAssump/100)^2 * (days to horizon/365)
|
|
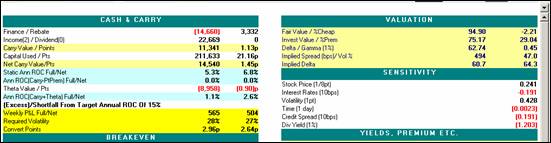
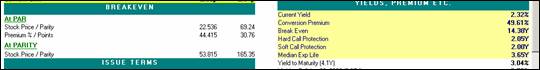
Outputs-Breakeven
|
Definition
|
|
At Par-Stock Price
|
If the stock price reaches the
level listed and the convertible goes to par/accreted value, the P&L will
go to zero using the current hedge.
|
|
At Par-Parity
|
Parity calculated based on the
stock price above
|
|
At Par-Premium
|
The Conversion Premium for zero
P&L for the above stock price
|
|
At Par-Points
|
The Point Premium for zero P&L
for the Parity above
|
|
At Parity-Stock Price
|
If the stock reaches this level
and the convertible trades with zero premium, the P&L will be zero
using the current hedge.
|
|
At Parity-Parity
|
Parity calculated based on the
stock price above
|
For more information on Breakeven see the commentary below
|
Outputs-Leverage
|
Definitions
|
|
Market Value Convert
|
The total market value on your
convert position. Market value Convert
= (Convert Price)(Convert Position)(10)
|
|
Market Value Stock
|
Total market value on your stock
position Market Value Stock= (Stock Position)(Stock Price)
|
|
Capital Used
|
The Capital used is the estimated
capital in dollars using the capital rules and rates.
|
|
Leverage
|
Leverage = Convert Market
Value/Capital Used. For example,
if you want a leverage of 4, then put the Convert Capital both to “Flat”
and the % stock to 25 and the other box to 0 %. This will give you a leverage of 4.
|
More Details:
Full Carry Vs Net Carry
Depending
on your financing situation, you should choose either full carry or net
carry. If you are part of an institution such as a bank where the financing
is charged on the entire long position, you should use the full carry. If
you are a hedge fund with margin treatment from the prime broker, and your
perspective is the expected profit-and-loss, you may want to use the net
carry. This is because, the prime broker will calculate the margin
requirement based on your agreement with them and will charge the financing
only on the portion of the long that you borrow. While using the net carry
gives you a more accurate estimate of profit-and-loss, it also makes the
cost of capital zero, which may not be appropriate if your perspective is
other than profit-and-loss.
Theta
The static cash-flow analysis
assumes that on the horizon date the stock price is unchanged, and so is
the convertible price. To be realistic we have to take into consideration
the convertible’s bond value accretion as well as option value decay over
time. We estimate this value (theta) by calculating the expected market
price for the convertible on the horizon date based on the current implied
spread, stock price, and volatility assumption. The difference between the
current convertible price and the estimated market price on the horizon
date is theta. This calculation
takes into account both the accretion of the bond value and decay of the
option value.
Required Volatility
We estimate the required volatility
from the weekly profit-and-loss requirement to reach the target return on
capital. The calculation assumes that you are trading stock for a 1% move
in the stock price based on the gamma of the convertible and that the stock
price is volatile around the current price. The weekly profit-and-loss
requirement itself is based upon your finance and rebate rates, capital
deployed, and carry horizon. In the market however, the stock price is more
likely to deviate higher or lower from the current levels, and your capital
requirements will change as a result. The theoretical valuation model on
the other hand does not know anything about your horizon date, and
leverage, but takes into account the entire structure of the convertible
such as call, put, and exercise schedules, etc; current yield curve;
volatility and credit spread assumptions and uses market’s expectation of
forward rates, and stock prices based upon probabilities. Given the vastly
different set of assumptions used to calculate the required volatility
based on cash-flows and the theoretical market implied volatility, they are
apples and oranges and should not be
compared. One should look at both the volatilities in the proper
context and make investment decisions.
Breakeven At Par
(Crosses Par)
The breakeven-at-par calculates the
stock price that gives a zero profit-and-loss effect using the current
hedge if the convertible trades at par/accreted value. Using this stock
price we also compute the conversion premium. Some market participants use
this metric to analyze how heavy the hedge should be, if they want to setup
a bearish hedge or want to hedge for potential deterioration of credit
spread as the stock prices decline. The idea is to challenge if the
convertible is likely to trade at the crosses-par premium, and refine the
hedge. While one can question the sanctity of the convertible trading at
par as the stock is declining, this metric is useful for analyzing
comparable convertible securities on a hedged basis.
Breakeven At Parity
The breakeven-at-parity calculates
the stock price that gives a zero profit-and-loss effect using the current
hedge if the convertible trades at parity, i.e. zero conversion premium.
This metric is useful in analyzing hedged convertible positions when the
convertible is currently callable or callable in a few months. Since many
CFOs tend to wait for the parity to cross 10%-15% over the call price
before calling their convertibles for redemption as a cushion, the market
also tends to trade on that basis as we get close to the call date.
Therefore, on a hedge basis, a breakeven parity of 110 is less risky than a
breakeven parity of 140 because if the stock rises, the risk of premium
collapse also increases, and will adversely affect both the long and the
short sides. Of course, this does not help assess the risk of cash calls in
low interest rate environments. This metric is also useful in analyzing the
risk from a cash takeover. If the company of the underlying stock is taken
over for cash at a low-to-moderate premium and the convertible is trading
at a high premium because of long call protection (option value), the risk
is evaporation of conversion premium as the option is abruptly terminated.
The breakeven at parity gives a threshold for the take over stock price on
the current hedge. If you have a view on the likely take over level for the
stock price, you can refine the hedge to minimize the takeover risk.
Examples for Capital Calculations:
We took two securities one with a low conversion premium
and one with a high conversion premium and compared the two with the
different capital rules.
NCEN 3.5%
2008 Premium: 9.58 Hedge: 77 Stock
Price: 40.86 Convert Price: 128.658
Convert Rate:
15% Stock Rate: 15% Point Premium:
11.24
EW 3.875%
2033 Premium 61.98 Hedge: 53 Stock
Price: 34.69 Convert Price: 102.799
Convert Rate:
15% Stock Rate: 15% Point Premium:
39.33
|
Capital Rules
|
NCEN- Low
Premium
|
NCEN Leverage
|
EW-High Premium
|
EW
Leverage
|
|
BrkDlr
Rule
Lesser of Convertible Rate on
Convertible Market Value + Stock Rate on Stock Market Value OR Point
Premium on Hedged Portion + Convertible Rate On unhedged portion
|
130,967
|
9.82
|
204,657
|
5.02
|
|
Flat
Convertible Rate on Convertible Market
Value + Stock Rate on Stock Market Value
|
328,603
|
3.92
|
204,657
|
5.02
|
|
PtPrm+
Entire
Point Premium + Convertible Rate on unhedged portion
|
156,827
|
8.20
|
465,807
|
2.21
|
|
PtPrm25C
Point
Premium on hedged portion with a cap of 25% of hedged Convertible Market
Value + Convertible Rate on unhedged portion
|
130,947
|
9.83
|
208,686
|
4.93
|
|
10-30
10% of hedged portion + 30% of
unhedged portion
|
187,835
|
6.85
|
199,422
|
5.16
|
|
PtPrm15C
Point Premium on hedged portion
with a cap of 15% of hedged Convertible Market Value + Convertible Rate
on un-hedge portion AND a floor of 2.5% on the total Convertible Market
Value.
|
130,967
|
9.82
|
154,199
|
6.67
|
If you have any questions regarding the Hedge Calculator
please give us a call 201.796.4900.
|