Rho Allocation
Our Rho Allocation Analytic allows
you to maintain assignments between instruments that need interest rate hedge
and instruments used to establish the hedge. Let us consider a portfolio
consisting of several convertible securities, corporate bonds, treasury bonds,
treasury futures, etc. You might have a short position in a five-year treasury
bond as an interest rate hedge against four different long convertible
positions with a median expected life of about five years. The proportion of the
treasury bond position against a specific convertible
security is a function of the position size and the interest rate sensitivity
of the convertible and the treasury bond. Our analytic allows you to maintain
the assignments, which could be static absolute, static relative, or dynamic.
You need to call us to configure the type of desired assignment. Brief
descriptions of the behavior of the three possible assignments follow.
![]()
Static Absolute
Assignment: This type of assignment
is based on number of bonds. Let us say, your treasury
bond position is -10,000, and you assign -3,000 to convert a, -5000 to convert
b, and -2,000 to convert c. These assignments will be static regardless of any subsequent
trades done on the treasury bond and/or convertibles.
You will have to make necessary changes to assignments as required in this
scenario.
Static Relative
Assignment: This type of assignment
is based on percentage of bonds. Using the same example above, Kynex will
maintain 30% for convert a, 50% for convert b, and 20% for convert c.
Therefore, if you trade the treasury bond in response
to changes in interest rates, the converts will get assignment in the same
proportions, i.e. 30%, 50%, and 20% of the new quantity. However, if you trade
one of the convertibles, you would have to make necessary changes to the
assignments.
Dynamic Assignment: This type of assignment is based on customized rules
used to make assignments dynamically at a specific time of day automatically.
This requires you to come up with the rules, and Kynex to set up a customized
framework for dynamic assignment. The advantage to this assignment is that
trades done on converts and treasury bonds will not need manual intervention.
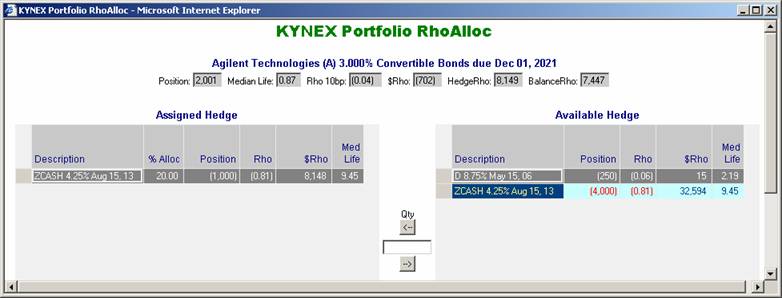
The snapshot below is a
picture of the Rho Allocation Application. The description of the security, the
current position, median expected life, rho, and hedged rho are on the top of
the screen. The various instruments that have been currently assigned as a
hedge to the security are on the left. Possible hedge instruments are on the
right. To specify a new assignment or a change to an existing assignment,
please follow the steps below:
-
Highlight the
security, on the left or the right which is the source.
-
Enter the number
of bonds in the box between the Assigned and Available Hedge securities.
-
Click the
left-to-right or right-to-left arrow button as applicable.
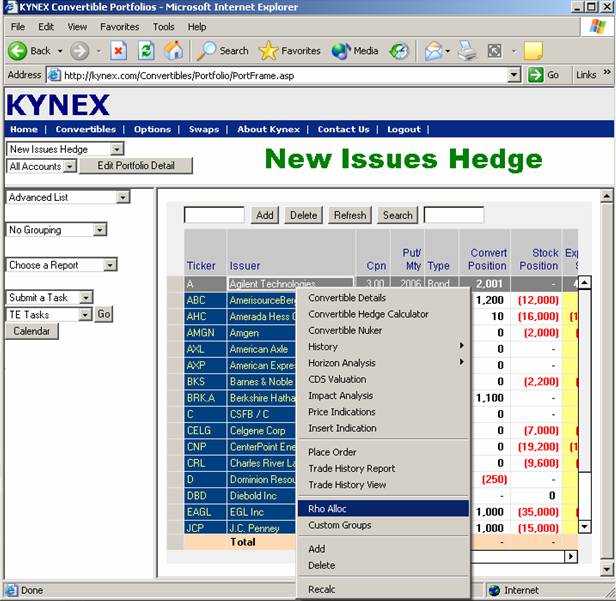
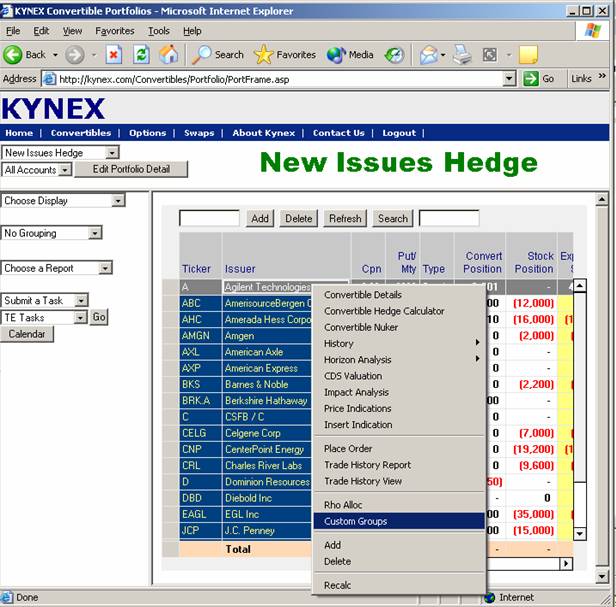
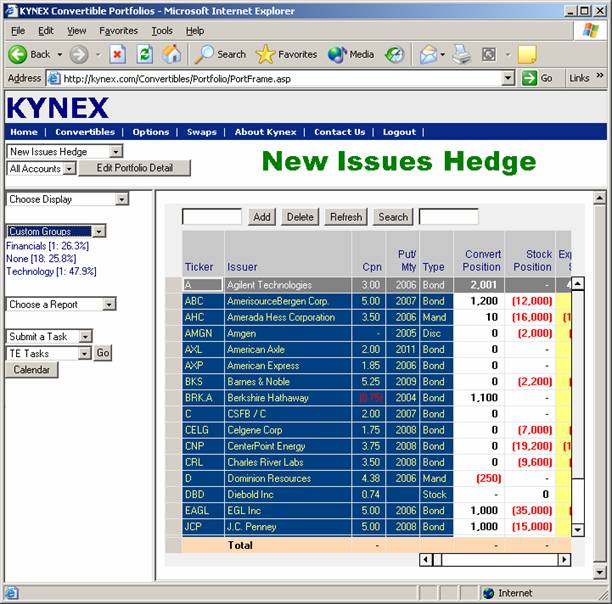
Custom Groups
Allows you to maintain an unlimited
number of categories for your portfolio, and tag securities into multiple categories.
For example, a security can belong to non-investment grade, bio-tech,
high-volatility, and trader xyz at the same time. You can access your Custom
Groups from the Portfolios page by clicking on any name in your portfolio, and
selecting Custom Groups from the menu, as shown.
![]()
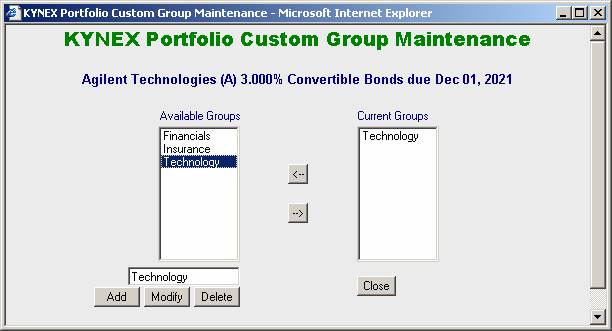
Please refer to the figure
below. There are two (2) columns in the Custom Group page: Available Groups,
which is a list of all the groups you have created; and Current Groups, which
are the groups that are currently assigned to the security that you clicked on
to open this page. To add a new group, type the group name in the textbox
underneath the Available Groups list, and click the Add button. To change a
group’s name, select it in the Available Groups list, change the name in the
textbox, and click the Modify button. To delete a group, select it in the
Available Groups list, then click the Delete button.
Use the arrow buttons
between the Available Groups and Current Groups lists to change the assignments
for this security. For example, in the window below, Agilent 3.000% is
currently assigned to the Technology group. To change the assignment to
Financials, you may select the Technology item in the Current Groups box, and
click the left-arrow button to remove it from the current assignments; then
select the Financials item in the Available Groups list, and click the
right-arrow button to add it to the current assignments.
Note that the previous
operation could also be performed in the reverse order (i.e. add Financials,
then delete Technology), and that any security can be associated with multiple
groups (i.e. have multiple groups present in the Current Groups list).
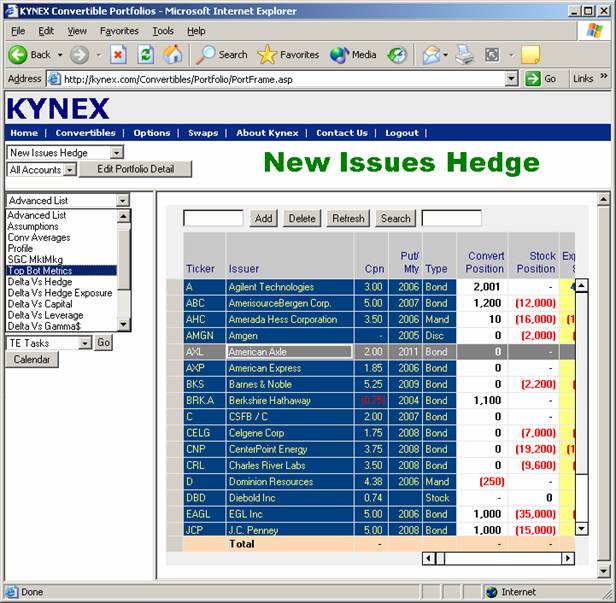
To view your portfolio by
Custom Groups, select the Custom Groups item in the Grouping drop-down menu, as
shown below.
![]()
Top and Bottom Metrics
Top and Bottom Metrics shows the
P&L or Impact by Strategy for a particular portfolio. In order for this
functionality to be meaningful, you need to group the securities in the
portfolio using the Aggregation Code, which is accessible in the Assumptions
view. To display this feature, select Top Bot Metrics in the Choose Display
drop-down menu:
![]()
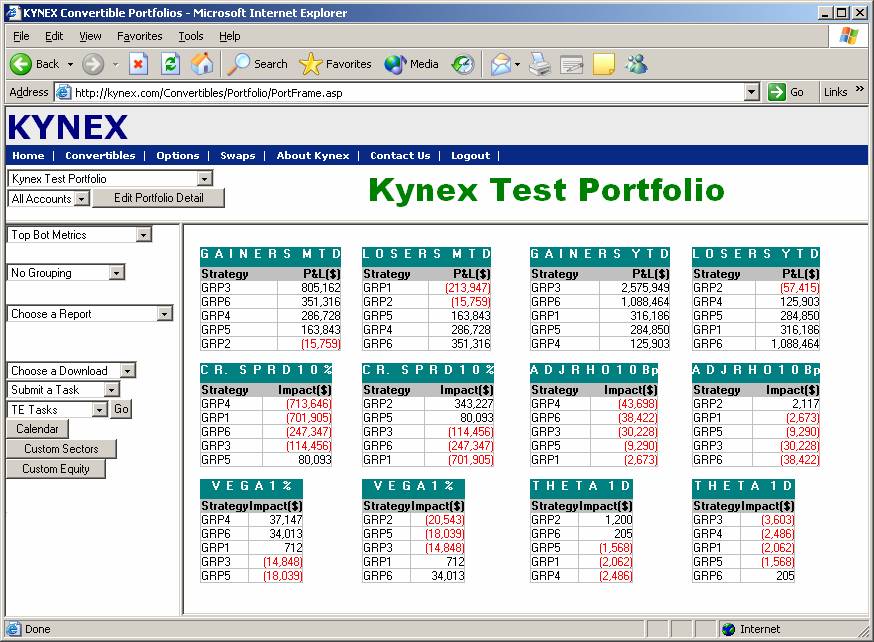
The top and bottom metrics
are calculated for Month-to-Date P&L, Year-to-Date P&L, Sensitivity to
Credit Spreads, Interest Rates, Volatility, Hedge Exposure, and Market Values,
as shown below.
Convertible
Market Valuation
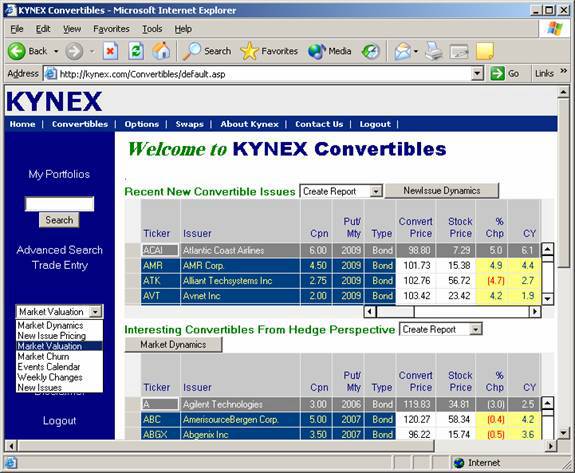
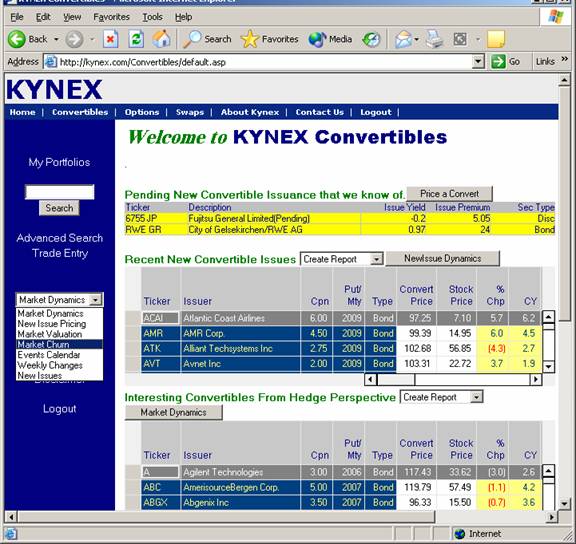
The Convertible Market Valuation section
can be accessed by clicking on the Convertibles link on the top navigation bar,
then selecting Market Valuation in the drop-down menu along the left side of
the page, as shown below.
![]()
![]()
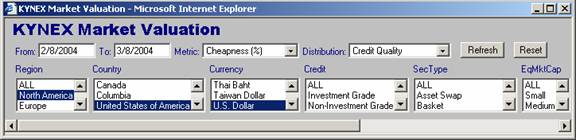
The Convertible Market
Valuation Section allows you to gain insight into dynamics of the convertible
market over time, by graphically viewing valuation metrics along two
dimensions, which could be filtered in many different ways. For example, you
can analyze how the implied volatilities have been changing grouped by credit
quality and filtered by economic sector.
The top frame of the screen
displays the choices for data presentation. The From and To fields are used to
select the date range for the data, while the Metric and Distribution control
the Y- and X-axis of the graphs, respectively.
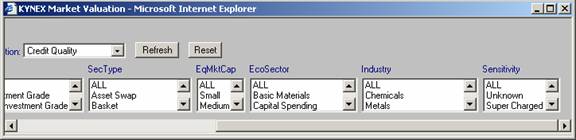
Using the appropriate
drop-down boxes, the data can be filtered by the following fields: Region,
Country, Currency, Credit, Security Type, Equity Market Cap, Economic Sector,
Industry, and Sensitivity. Multiple selections can be made in each field by
holding down the CTRL key and individually clicking on each desired menu item.
Note that selecting the ALL option on the top of a menu, or not selecting
anything in the menu, will have the same effect of returning data corresponding
to all of the items in that menu.
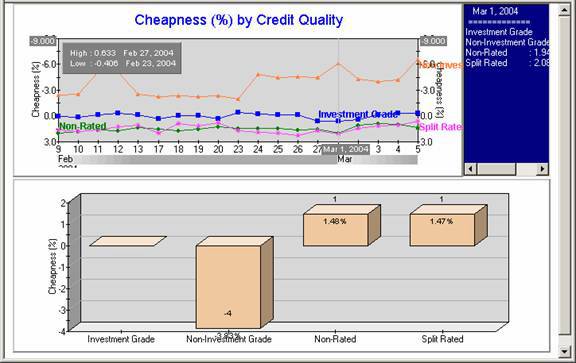
Once the desired criteria have been selected, click the Refresh button to view the results in the bottom frame of the screen.
Typical output graphs are
shown below.
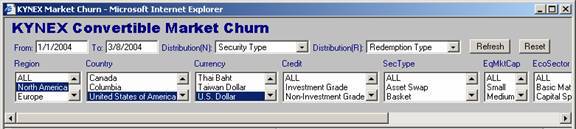
Convertible Market Churn
The Convertible Market Churn section
can be accessed by clicking on the Convertibles link on the top navigation bar,
then selecting Market Churn in the drop-down menu along the left side of the
page, as shown below.
![]()
The Kynex Convertible Market
Churn allows you to analyze the new issuance and redemption proceeds over a
specified period.
The top frame of the screen
displays the choices for data presentation. The From and To
fields are used to select the date range for the data. There are two (2)
Distribution drop-down boxes: one for the New Issuances (N) table or graph, and
one for Redemptions (R).
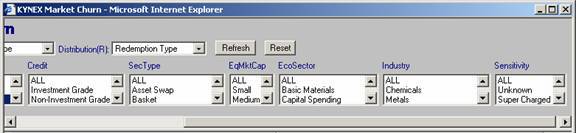
Using the appropriate
drop-down boxes, the data can be filtered by the following fields: Region,
Country, Currency, Credit, Security Type, Equity Market Cap, Economic Sector, Industry,
and Sensitivity. Multiple selections can be made in each field by holding down
the CTRL key and individually clicking on each desired menu item. Note that
selecting the ALL option on the top of a menu, or not selecting anything in a
menu, will have the same effect of returning data corresponding to all
of the items in that menu.
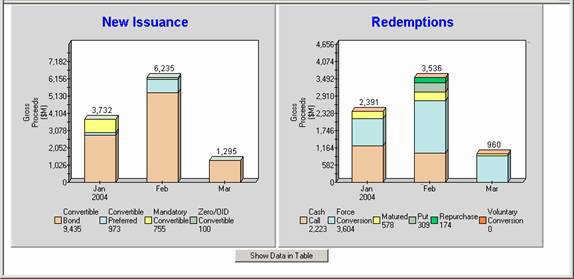
Once the desired criteria have been selected, click the Refresh button to view the results in the bottom frame of the screen. By default, the graphs are shown first. To show the data in tables, click the Show Data in Table button at the bottom of the page. To switch back to the graphical view, click the Show Data in Graph button.
Typical output graphs:
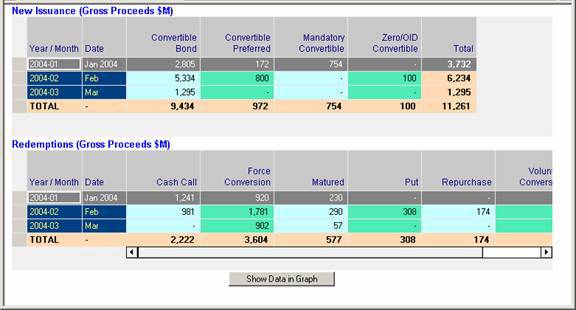
Typical output tables:
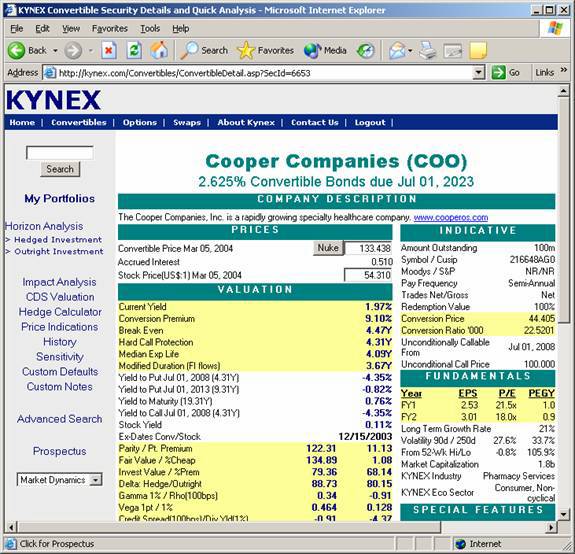
Prospectus
Displays an electronic version of the
prospectus, book marked with links to critical sections of the prospectus such
as call schedule, conversion details, change-of-control provisions, dividend
protection provisions, etc. that help you navigate and find the information you
are looking for quickly and easily.
The Prospectus page is
accessed from the Convertible Details page, which can be opened in several
ways:
·
From the My
Portfolios page, click on any security, and select Convertible Details from the
menu.
·
Click on the
Convertibles link on the top navigation bar, click on any security in the
tables, and select Convertible Details from the menu.
·
Type the ticker
of the underlying equity in the Search box, and click the Search button to pull
up the Convertible Details page for that security.
From the Convertible Details page, click
on the Prospectus link on the left side of the page, as shown below.
Our team is tagging the electronic prospectuses digitally, starting from the
recent issues and working backwards in time. If we have not yet tagged a
prospectus, you will not see the Prospectus link for that security.
![]()
The Prospectus page will then
open in a new window:
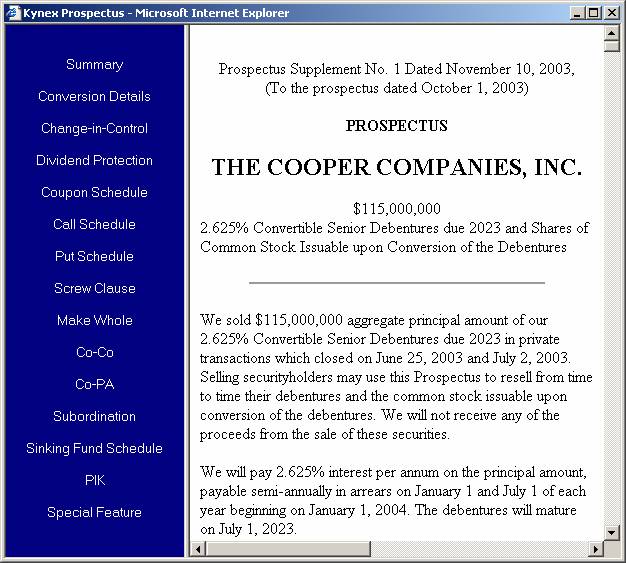
The right frame of the
Prospectus screen contains the entire prospectus document. Links to specific
sections of the prospectus are found in the left frame. Clicking on any of
these links will automatically scroll the document to the appropriate section,
if that section actually exists in the prospectus.