KYNEX Bulletin
May 2008
Corporate
Bond versus Credit Default Swap
The Kynex “Corp Vs CDS” analytic is intended to detect and quantify deviations between the bond market and the CDS market. It is intended to suggest possible trades in the CDS market as well as the bond market for a given issuer or issue. Client feedback regarding our “Corp Vs CDS” analytic, as first presented in our September 2007 Flash Bulletin, has encouraged us to revise the presentation of the results. Functionality is highlighted here, and you can follow the links for additional detail and explanation.
v
Given a bond price and its corresponding CDS
credit curve, the fair value of the bond is calculated using the
CDS credit curve, and an implied CDS
curve is determined based upon the bond price. In this way, you can
identify richness/cheapness in bond terms and in CDS terms, and hence potential
trades. Richness/cheapness is identified in terms of both dollars and spread.
v The Kynex bond calculator will now accept a CDS credit curve. The bond price is calculated using the CDS curve, and then all subsequent measures are calculated in the usual way.
v By definition, all CDS spreads are par spreads. When applying CDS credit curves to discount (bond coupon is less than risk-free plus CDS spread) or premium (bond coupon is greater than risk-free plus CDS spread) bonds, bond spreads are adjusted for Pull-to-Par using a Kynex algorithm based upon total risk and observed market prices. Please see the Appendix for a complete discussion of Pull-to-Par in both a risky and risk-free environment.
v
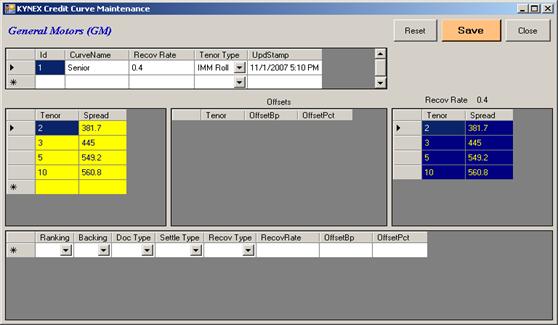
Kynex allows you to maintain credit curves in
two different ways. You can use our Credit Curve Maintenance
Utility on individual credits. You
can also transmit via FTP credit curves for numerous credits on a periodic
basis. If you maintain a portfolio of corporate bonds with prices as well as
credit curves on these credits on Kynex, we can automate the process of
identifying potential trading opportunities. Kynex will do the data maintenance for you, and you can focus on trading.
We know that some of our clients prefer one source of credit curves over
another, so it is important that you send us your view of the curve. If a bond
is subordinated and if Kynex has a subordinated curve, the subordinated curve
will automatically be used on the “Corp
Vs CDS” analytic and the bond calculator.
v
If you know a bond price but the CDS curve is unknown,
you can calculate the implied CDS credit
curve consistent with that price. CDS spreads can be specified at multiple
tenors to establish curvature.
v
For convertible securities, the coupon is
obviously not just determined by a spread over a benchmark curve. A convertible
investor will give up coupon in return for more option-value on the underlying
stock. Kynex is comfortable using CDS credit curves to evaluate a newly issued
convertible priced at par if bankruptcy mode is turned on and a spread decay
factor has been assumed. It is less
clear how to apply credit curves to convertibles in the secondary market that
are no longer at par. Kynex will address this issue in a future bulletin.
v
If the bond market and the CDS market
essentially agree, there is no trade. But
the unfolding credit crisis (as well as special situations involving specific
companies) is providing opportunities. Generally, bond spreads are widening vis-à-vis
CDS spreads since the autumn of 2007. Especially
for riskier bonds, we believe that
bonds have over-reacted to the credit crisis, while tight credits appear to
have widened to a lesser extent. The
current inconsistency between the bond market and the CDS market can also be
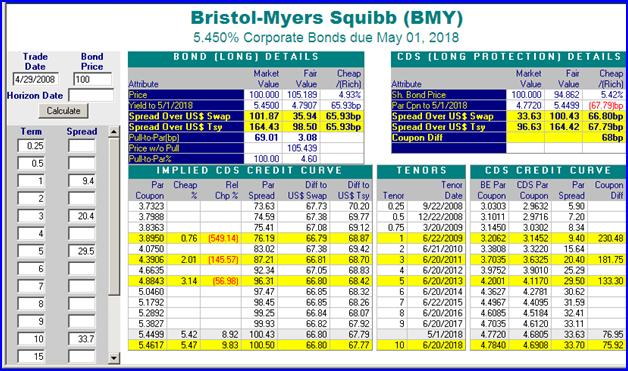
seen in newly issued bonds. A “credit
crunch” premium of 50-75 bps seems to be added to the coupon (e.g. BMY, DELL).
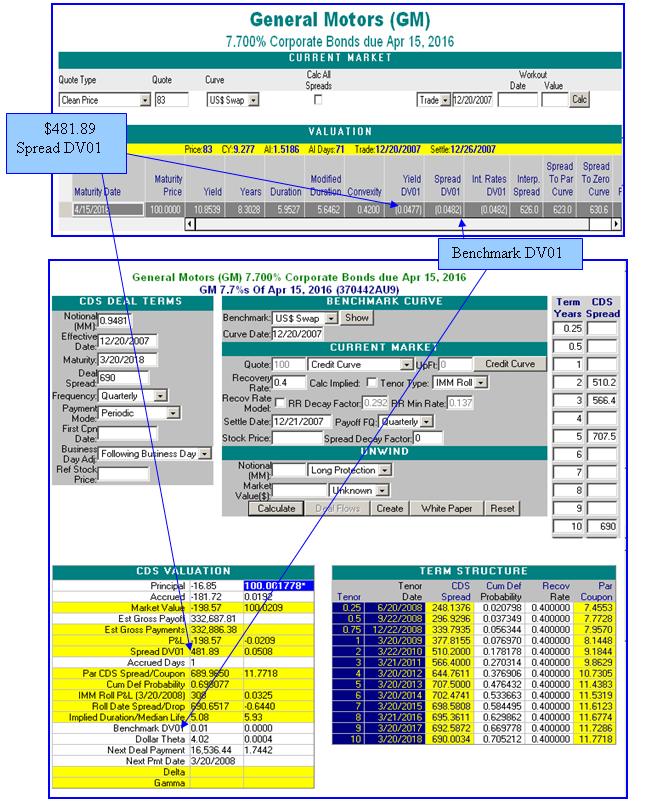
Corp Vs CDS
You can navigate to the Kynex “Corp Vs CDS” analytic by first
selecting a corporate bond and going to the calculator. From there, you should
select the “Corp Vs CDS” link in the left-hand blue margin. For illustrative
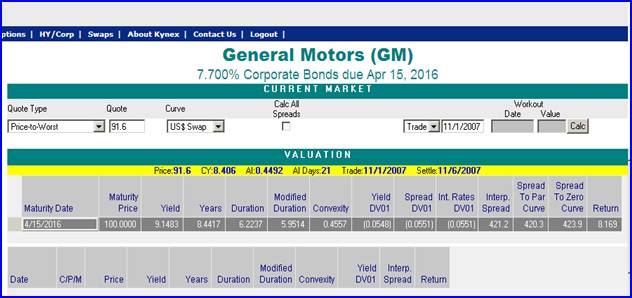
purposes, we chose the GM 7.7%
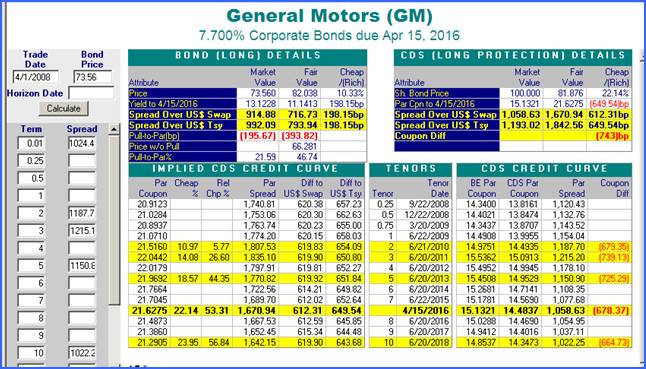
Corp. Vs CDS Analysis
GM 7.7%
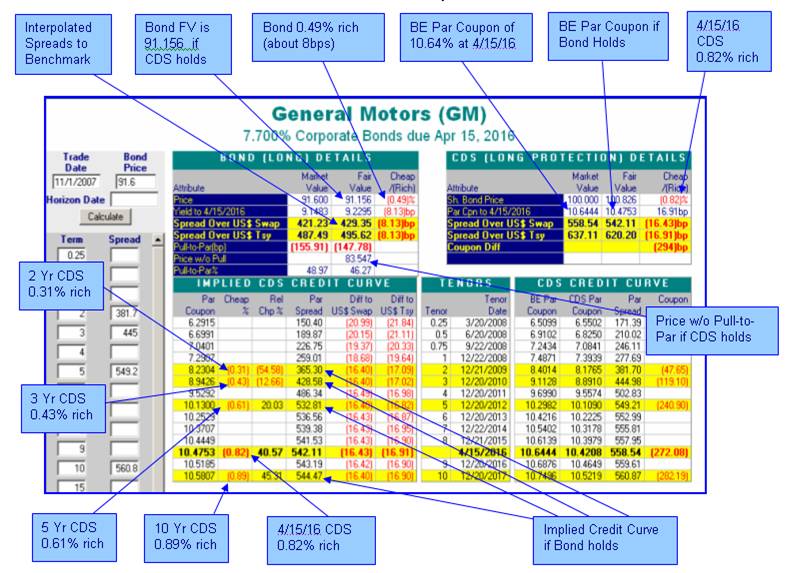
![]()
![]()
![]()
In this case, the bond market and
the CDS market basically agree. If the CDS market holds exactly, then the bond
would be priced at 91.156 rather than 91.60. In terms of bond points, the bond
is rich by 0.444 bond points, which is 0.49% of the fair value. This difference
is well within the bid-ask spread. In terms of spread, the bond is about 8 bps
rich. The fair value is below par because the 7.7% coupon is 294 bps below the bond
equivalent (BE) par coupon of 10.6444%. The par coupon is determined by the CDS
calculator using the input credit curve on the left margin. In this case, the
par CDS spread is equal to 558.54. The spread over Treasury is not computed by
re-calculating the probability of defaults using the Treasury curve as the
risk-free curve. Rather, the spread of 637.11 merely reflects the risk-free
yield difference between swap and Treasury on
As of
Change in Benchmark Curve, No Change in Credit Curve
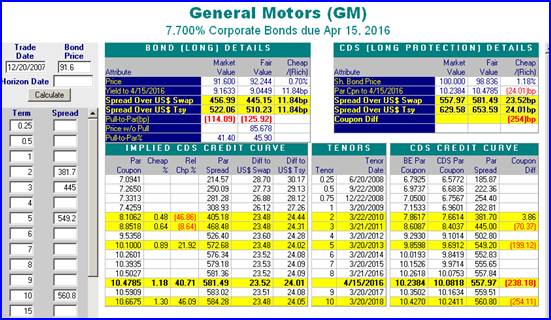
Change in Both the Benchmark Curve and the Credit
Curve
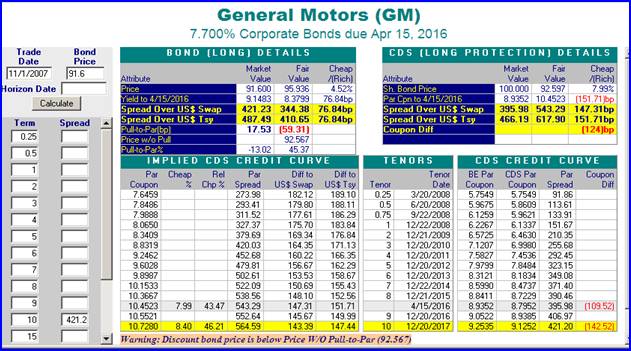
But the credit curve widening has produced a par coupon of 11.65% from 10.24%. The fair value yield of the bond has widened 68bps to 9.721% because of the spread change, and it tightened by 18.4bps due to the benchmark tightening. The aggregate yield widening is about 50bps while the aggregate spread widening is about 83.5bps.
The bond has gone from being a little rich to
very cheap when compared to the CDS market. The CDS spread to
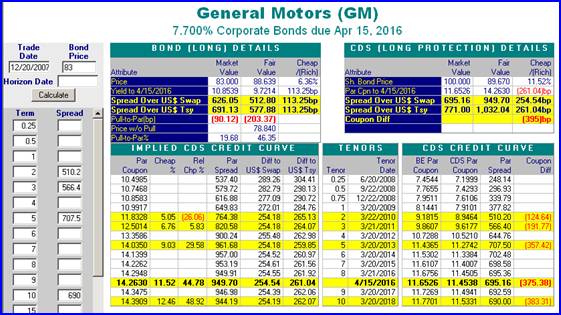
The no arbitrage trade on this is obvious. Buy 1000 bonds at 83 and buy $948,100 notional 10 year protection at 690 in order to match spread dv01. The annual coupon payments ($77,000) received more than cover the annual deal payments (approximately $66,327) paid. If the GM credit deteriorates further, the CDS should “catch up” to the bond by widening more than the bond. If the GM credit improves, the bond should “catch up” to the CDS by tightening more than the CDS.
The speculative trade depends upon your view. If the bond market has overshot its penalty on this GM bond, the bond should be bought with the expectation that the market will correct to the CDS market levels. But if the bond market has it right, the CDS should widen, so protection should be purchased. Shorting the bond would be difficult at best in this situation.
Unfortunately, a third
possibility exists. What if both the bond market and the CDS market have it
wrong? By
GM 7.7%
0.4257. But the yield-to-risk
ratio at par is 0.312 (par risk is 48.475).
A rational long-only investor would rather buy the 7.7% coupon bond at 73.56 than
a 15.13% coupon bond at 100. This
statement assumes the CDS market is correct. For GM, the bond market and the
CDS market are more disconnected than ever by
Fortunately, the GM bond “death
spiral” does not totally kill the no-arbitrage trade mentioned above. By
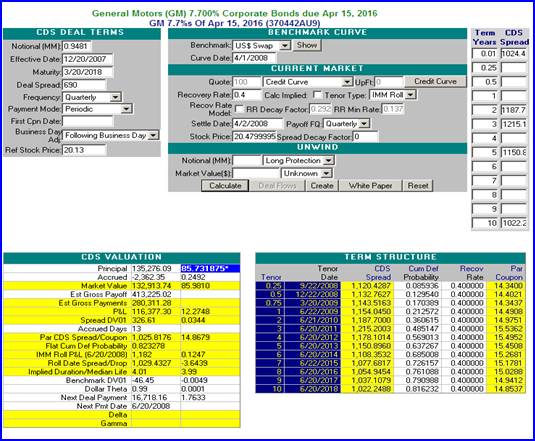
The results of the hedge are summarized below.
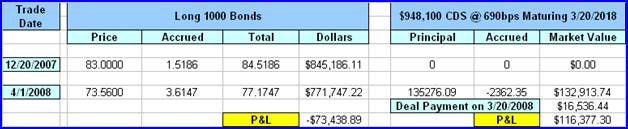
The coupon on the bond really helped the total position.
Tight credits
exhibit disconnect between the bond markets and the CDS markets to a lesser
extent. The JNJ 5.55%
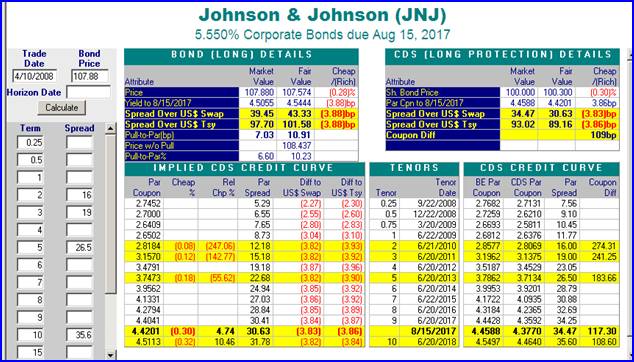
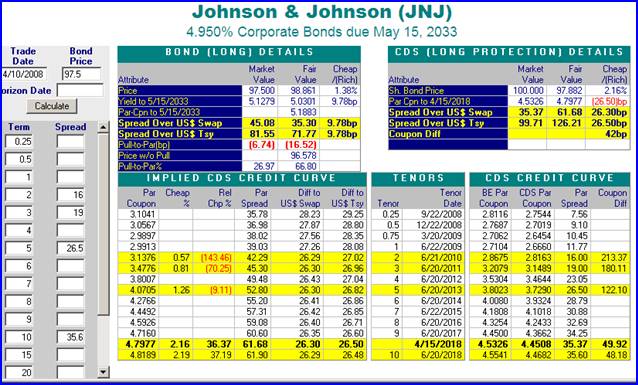
But as of

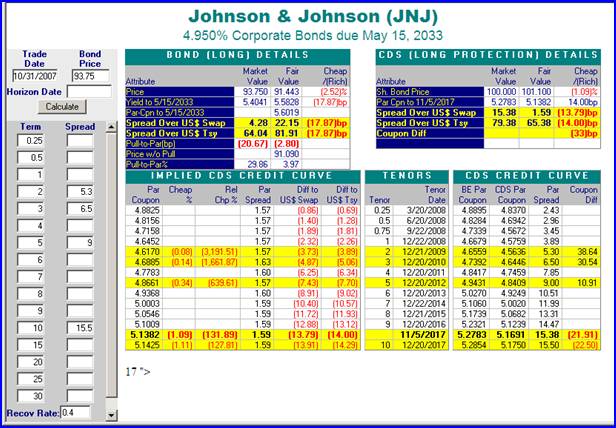
It is interesting to note that
par coupons on JNJ actually declined from
Determining the CDS Credit Curve from Bond
Prices
Because the Kynex “Corp Vs
CDS” analytic calculates an implied curve, you can use the following
methodology to arrive at the appropriate CDS curve given a single bond price.
This methodology assumes the bond market is consistent with the CDS market. For
illustrative purposes, consider once again the GM 7.7%
The interpolated spread of 421.2 should then be used as the CDS spread at the nearest tenor to the maturity of the bond. The results are below.
The implied curve suggests that the 10 year point must be 564.59 if the bond price is correct. Since the entire implied curve is shown, you can decide if the curvature is appropriate. Suppose you wish to front load additional default early on. You can accomplish this by specifying a larger value (300 rather than 273.98) at the quarter year tenor.
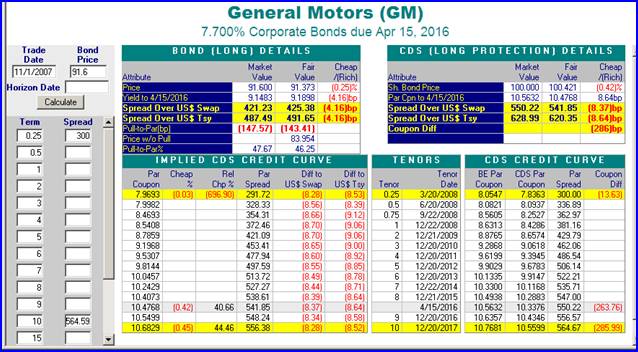
The implied curve gives the desired curve. In this case, two tenors define the curve. The quarter year tenor is 291.72, and the 10 year tenor is 556.38. Kynex uses a logarithmic model that tends toward a spread of zero at settlement (unless overridden by inputting the desired value for tenor of 0.01). It is most appropriately used for investment grade names. For high yield bonds, flat to inverted curves should be used. Curvature and shape will affect the final result. Graphs of the CDS forward rates are shown at the bottom of the CDS Valuation analytic (please refer to the December 2006 Kynex Bulletin for a discussion).
More challenging problems are
long dated bonds with wide spreads. Consider the WM $7.25 preferred perpetual
trading on
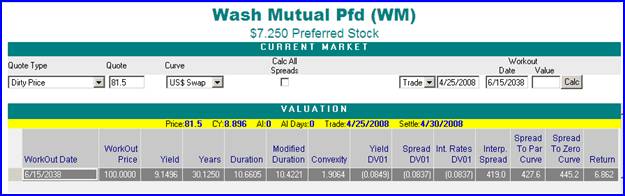
The spread of 419 should be used at the 30 year tenor point. The implied curve gives a CDS spread of about 490 at the 30 year tenor. But the WM senior curve is inverted. The difference between the one year point and the 10 year point is about 365 basis points. Therefore, the front part of the subordinated preferred curve should be front loaded as well.
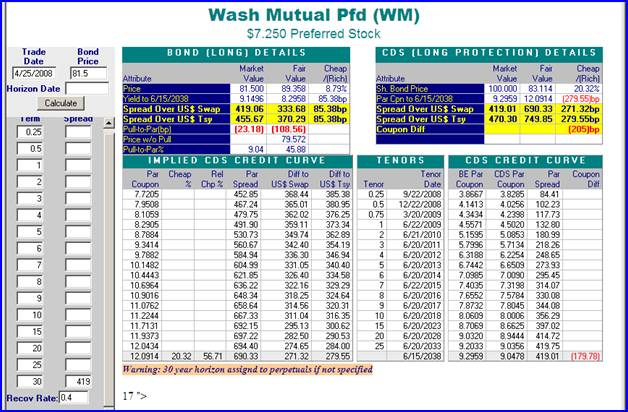
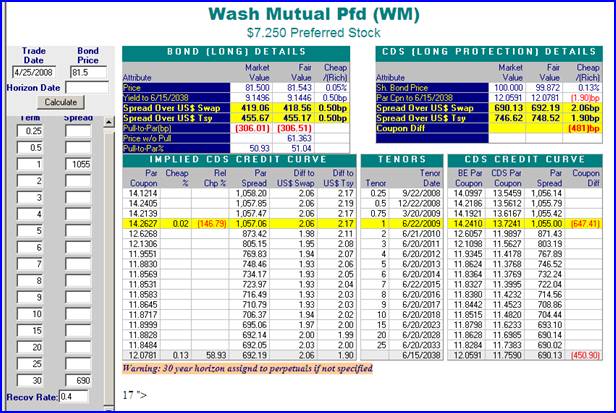
The implied curve gives the
preferred curve for WM if the bond price holds.
Spreads can be wide enough to make default a certainty before 30 years.
Prices and spreads can be inconsistent.
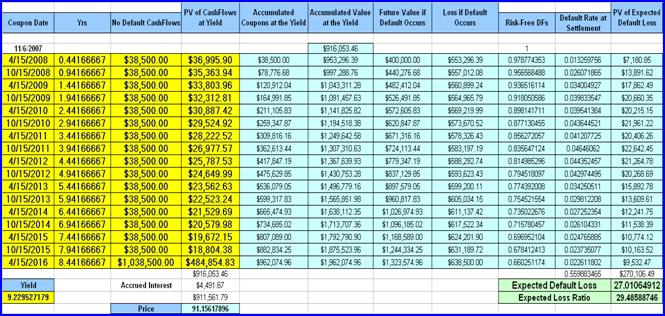
For a particular credit, currency and subordination level, identifying the bond equivalent par coupon is a necessary first step in order to determine the bond fair value. The par coupon identifies what the coupon would have to be if the issuing company issued a new corporate bond at par. The term structure of these par coupons is presented by the Kynex CDS calculator if a credit curve is specified. If par cannot be identified, it is certainly impossible to accurately price a bond with a lower or higher coupon. Kynex par coupons are bond equivalent, and they have been slightly adjusted so that the Price-Without-Pull-to-Par of a bond with a par coupon has a par price (par is precisely defined here as the flat price when the yield is equal to the coupon, e.g. almost 100.0 when not settling on a coupon date). The Price-Without-Pull-to-Par for any bond is calculated as the risky present value (using the swap benchmark curve and the CDS credit curve) of the bond’s future cash flows. Once you have accepted the credit curve as accurate, this calculation is rather mechanical. As such, it provides a valuable yard stick not only for theoretical fair values but for market prices as well. In this example, the Price-Without-Pull-to-Par is $83.547. However, the market pulls the market price up to $91.6 (which is 48.97% to par).
Pull-to-Par
is a phenomenon usually discussed in the context of embedded options in a bond.
However, it would be erroneous to conclude that a bond without calls does not
exhibit Pull-to-Par. At other times, Pull-to-Par refers to the inexorable price
movement to par as settlement approaches maturity. Pull-to-Par is defined here
as the tendency that prices of bonds with coupons other than par are “pulled”
back to par the greater the coupon deviation from par. Prices on discount bonds are pulled a bit higher, and premium bond
prices are pulled a bit lower because of risk differences. Even in a risk-free market (e.g. US Treasury)
in which default is assumed to be impossible, bonds exhibit Pull-to-Par (please
see the Appendix for a discussion) because of
the differences in interest rate risk. In risky markets, risk differences
are greater, and therefore, the “pull” is greater. Discount bullet bonds
exhibit Pull-to-Par because they have less default loss if default occurs. Since they are purchased at a discount, you
have less to lose. Note that discount bonds have more interest rate risk (the
lower the coupon the higher the duration). Conversely with premium bonds, you
have more to lose because you paid more than the face for the bonds. If the
premium bond continues to survive without defaulting, the higher coupon does
partially alleviate this extra potential loss. Pull-to-Par on a premium bond is
frequently referred to as price compression (back to par). Once the par
coupon is properly identified, everyone can agree on the direction of the pull.
A strong market consensus on the
magnitude does not always exist.
In the financial literature, a good deal of time has been spent analyzing the CDS basis, defined as the differential between CDS and bond spreads. Because of Pull-to-Par, the CDS basis cannot be constant. It must vary by bond coupon and the corresponding total risk of the bond. Studies that average the spreads on discount bonds with those of premium bonds ignore a fundamental pricing concept in bond trading (corporates as well as mortgage passthrus).
The Kynex
Pull-to-Par algorithm is based upon total risk, and it is based empirically on
market prices as well as a self-calibrating component that will adjust to
changing market conditions. The CDS market is assumed to be consistent with the
bond market, and therefore, it is used to determine default probabilities as
well as the par coupon in the bond market.
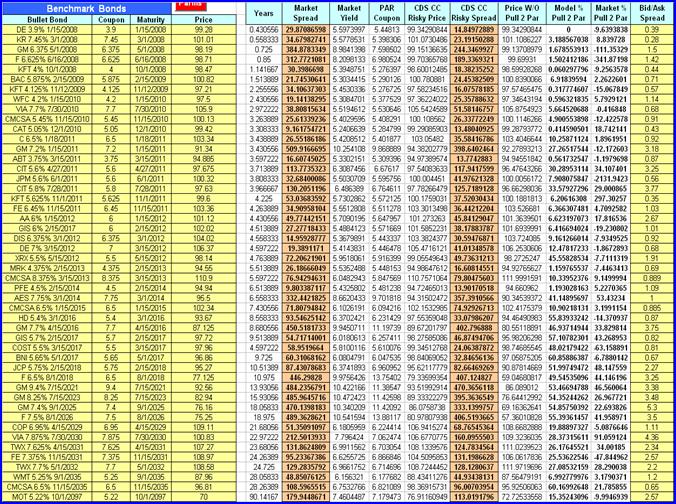
During the autumn and late summer of 2007, we believe the bond market
essentially agreed with the CDS market (please see sample
bonds in the Appendix). A par coupon
bond must be priced at par. Therefore, Kynex measures the total risk associated
with this par coupon bond in order to determine the yield-to-risk ratio. Given the same
credit and subordination level, the buyer
or seller should be theoretically indifferent to the coupon level he chooses to
buy or sell (excluding liquidity and special situations). Therefore, a bond
must be priced so that its yield-to-risk ratio matches that of the
corresponding par coupon bond. All bonds
with differing coupons should be equally efficient in terms of risk/reward.
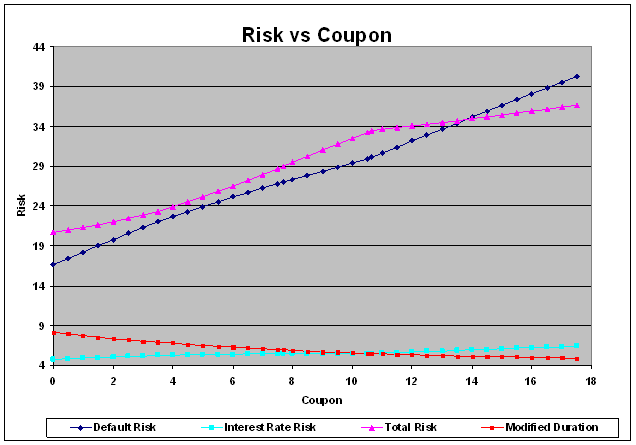
Risk is comprised of three components. Total risk is comprised of default,
interest rate risk and coupon risk. Default risk is defined by the expected
loss of the bond due to default. A sample calculation
is in the Appendix, and it essentially measures the present value of the
expected default once the effect of accumulated coupons has been added in.
Interest rate risk is defined as the yield dv01 of the bond. Coupon risk comes
about because the par coupon is constantly changing as the benchmark curve and
the credit curve change. Penalties for coupons below the current risk-free rate
are also included in coupon risk. All
pricing is done relative to the par coupon, and therefore the base relationship
between yield and risk is self-calibrating. For example, you are willing to
buy a discount bond offering a lower coupon, a lower yield and greater interest
rate risk (as measured by modified duration) because the expected default risk
is so much lower. Without efficient
pricing, no rational investor would ever buy a discount bond if there is a
choice. Conversely, a premium bond is not so attractive because the
expected default risk grows rapidly despite the lower interest rate risk. The
Kynex Pull-to-Par algorithm can best be understood by showing how the algorithm
would price the GM 7.7%
Kynex Pull-to-Par Algorithm
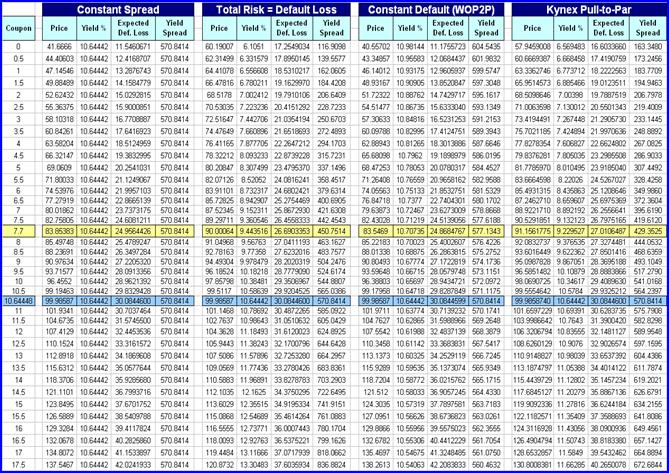
GM 7.7%
Additional Coupon Levels Shown
For comparison purposes, please
find in the Appendix a table showing several pricing
hypotheses which we reject as overly simplistic. The results in that table
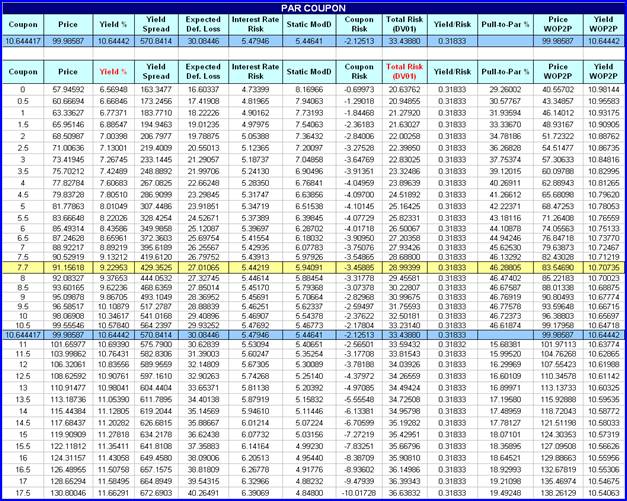
are graphed below. The “Yield vs Coupon” graph shown below plots yield versus
coupon for the four pricing hypotheses. The yield based upon
Price-Without-Pull-to-Par (YWOP2P) is roughly equivalent to the constant spread
assumption. For discount bonds with coupons close to par, the Kynex yield
closely follows the assumption that total risk is entirely defined by default
(little adjustment for interest rate risk and par coupon volatility). Discount bonds are inherently attractive since they are
redeemed at a price above the purchase price. Investors are more cautious of
premium bonds whose price will trend down to par over time.
GM 7.7%
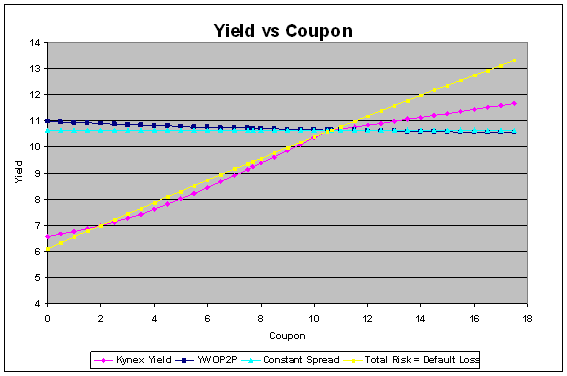
The graph of “Price vs Coupon”
(above) shows that the fair value price basically follows the default loss
curve for discount bonds. For premium bonds, the default loss curve “pulls” the
fair value curve away from the PWOP2P curve. Not surprisingly, the PWOP2P curve
is a linear function of the coupon (unfortunately, pricing is not that easy).
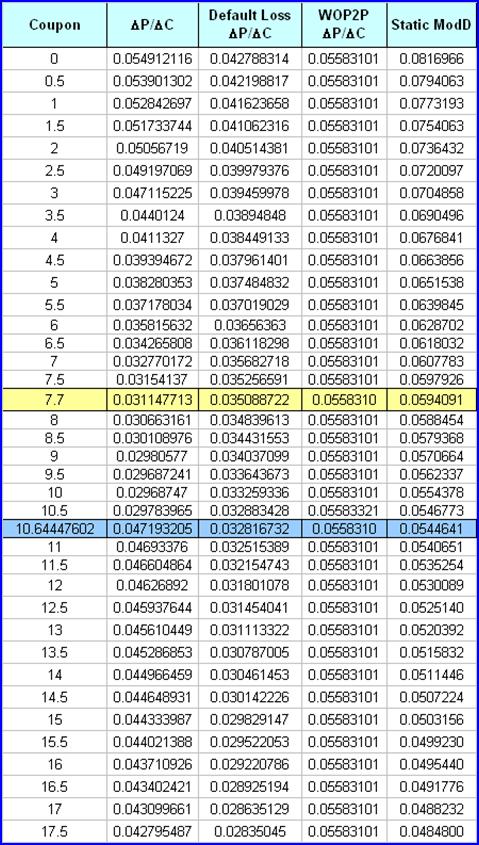
The Kynex Pull-to-Par algorithm will make the total risk values be an increasing function of the coupon. The larger the discount, the smaller the risk. The larger the premium, the larger the risk. For very high coupon bonds, the accumulated coupons offset the higher default risk.
GM 7.7%
Other relationships are less
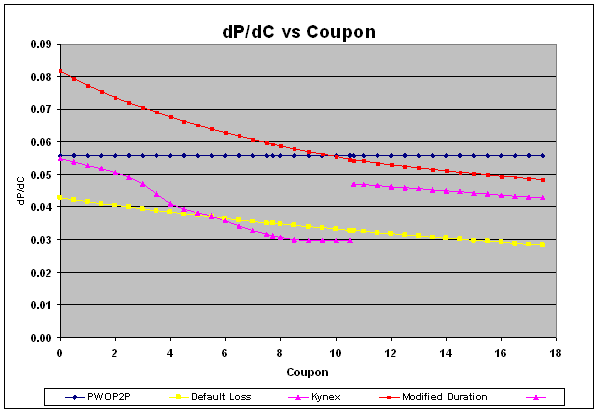
obvious. Please refer to the dP/dC section of the Appendix as well as the graphs below
showing “dP/dC vs Coupon”. Since the price-without-pull-to-par (PWOP2P) curve
is a linear function of the coupon (C), the DPWOP2P/DC is constant. Further, it must serve as a
cap for DP/DC. Therefore, the
following relationship holds for any given coupon level.
![]()
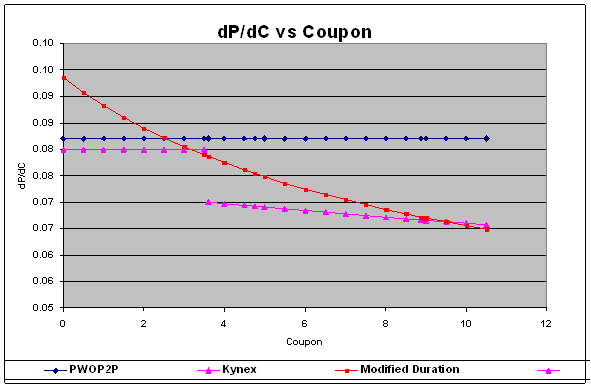
As the discount deepens, DP/DC approaches DPWOP2P/DC. For premium bonds, DP/DC decreases as price compression increases for increasing coupons. The discontinuity in DP/DC at par exists even if default is impossible. Every attempt at smoothing creates inferior pricing around par for discount bonds as well as premium bonds. For Treasuries, the risk-free rate acts as a yield floor for discount bonds as the coupon goes further below par.
GM 7.7%
T 4.75%
Calculation of Price-Without-Pull-to-Par
Using PV Cost of Default
GM 7.7%
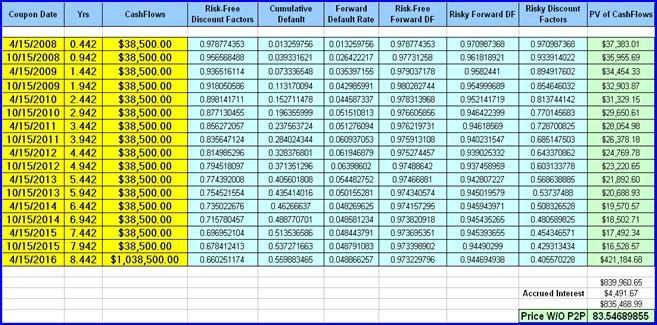
Note: The discount factors and default rates shown
above take into consideration
the difference in standard settlement between bonds
and CDS.
PV Cost of Default Model explained in the December 2006
Kynex Bulletin.
Bond Equivalent Adjustment from CDS Par
Coupon
GM 7.7%
CDS Par Coupon = 10.4208%, BE Par Coupon = 10.6444%
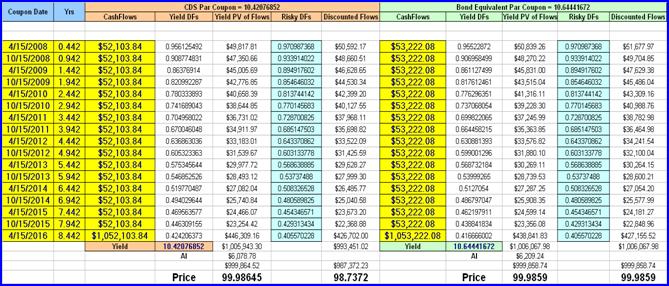
Yield
and coupon are determined so that they are equal and the price based upon the
yield is equal to the price of the discounted flows using the risky rates
derived from the CDS credit curve. As shown above, the CDS Par Coupon must be
adjusted for this constraint to hold. Most of this adjustment is required
because of the adjustment from a quarterly ACT/360 basis to a semiannual 30/360
basis. For example, a 10.4208% quarterly Actual/360 rate is equivalent to a
10.71% semiannual 30/360 rate. This adjustment to the coupon rate ensures the
Price-Without-Pull-to-Par is exactly par for a par coupon bond.
Treasury Prices Exhibiting Pull-to-Par
T 4.75%
(
T 4.75%
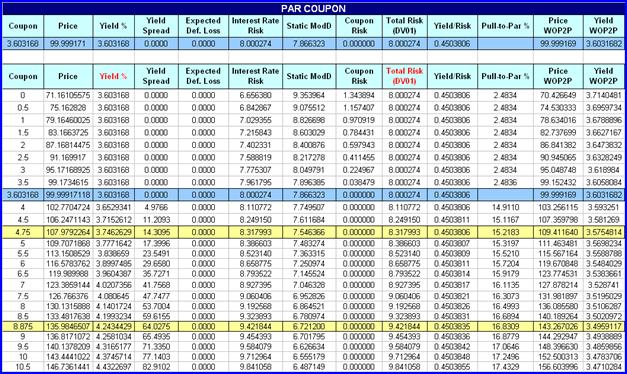
In order for
the buyer to be theoretically indifferent, T 4.75%
GM 7.7%
Comparison of Alternate Pricing Hypotheses
GM 7.7%
1000 GM 7.7%
Sample Bonds Priced on
Using mid-market CDS spreads, the par coupon is 4.77 but
the coupon is 5.45. The coupon penalty for BMY imposed by the bond market
appears to be a substantial 68 bps.
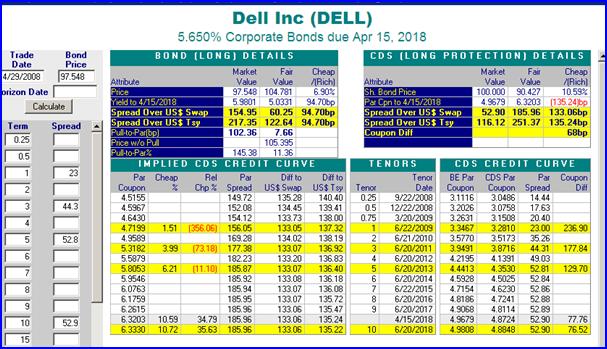
Using mid-market CDS spreads, the par coupon is 4.97 but
the coupon is 5.65. The coupon penalty for DELL imposed by the bond market
appears to be about 68bps.