KYNEX Bulletin
July 2009
Corporate Bond (with Financing) versus Credit Default Swap
Since the release of our
first “Corp
Vs CDS” analytic (May 2008 Kynex
Bulletin), the credit markets have changed dramatically. Even by the end of
April, 2008, we noted that a “credit crunch” premium of 50-75 basis points was
added to the coupon suggested by the CDS credit curve on newly issued bonds.
Investors were paying additional financing costs, so they demanded an
additional premium on top of the coupon suggested by the CDS market. Our model
had no way of reflecting this additional premium. We are pleased to announce
the following enhancements in response to the dynamics in the market.
v You
can now specify your financing assumption in basis points over 3-month LIBOR. This
assumption reflects the borrowing cost associated with financing the cost of
purchasing the bond long. Since the CDS is an unfunded transaction, the relative
value comparison to the bond must be funded regardless of whether the investor
is hedging or is investing outright. However, you can specify no financing by
“blanking” the financing input (a zero assumption will use financing at Libor).
v We
have developed a new model based on a Zero P&L Basis Trade. The Zero P&L Basis Trade Model uses
a carefully constructed basis trade consisting of a
long bond position, long CDS protection and an interest rate swap. The price of the bond is determined so that
the expected aggregate P&L of the basis trade is zero on the maturity date
of the bond regardless of whether default occurs. The previous model based on
Pull-to-Par is available as an option. A detailed description of the Pull-to-Par Model can
be found in the May 2008 Kynex Bulletin. A comparison
of the two models for a five year bond assuming a range of flat CDS spreads and
bond coupons is shown in the Appendix as well as a discussion of the advantages
and disadvantages of each model.
v Trading
opportunities in the investment grade, primary market appear to be few and far
between suggesting the CDS market and financing requirements drive new issue
pricing. Pricing irregularities in the secondary market seem to be relatively
common, resulting in a bond price disconnected from the CDS market. We present
a basis trade taking advantage of such a
situation.
v The
shape of the CDS credit curve and hence the default probability path will
affect the fair value calculation of the bond. Wider spreads and/or inverted
curves will increase the deviation in results from a credit curve vis-à-vis a
flat spread. We present an illustration in the
Appendix. Currently, we do not support the upfront loading of the probability
path corresponding to a “running + upfront points” CDS quotation.
v If
you maintain credit curves on Kynex and/or send us your credit curves
periodically, the “Corp
Vs CDS” analytic conveniently starts with your assumptions. If
you send us a list of bonds with their prices and credit curves, we can
automatically search for those bonds with a pricing disagreement between the
bond market and the CDS market, thus significantly enhancing the productivity
of your team.
Corp Vs CDS
We analyzed several corporate
bonds and the corresponding CDS market levels at different points in time over
the past several months when the financing requirements have been changing. We
present our findings and analysis below.
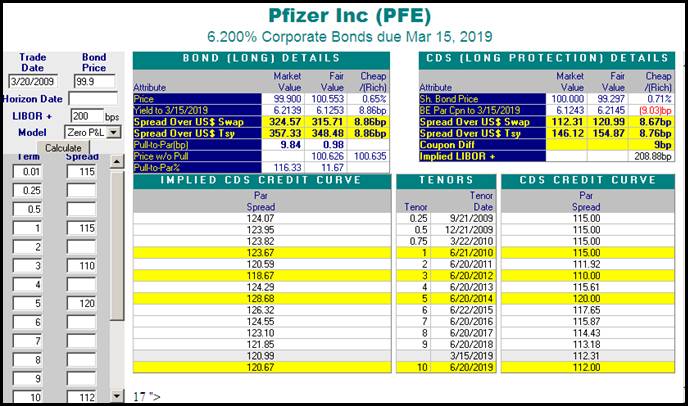
For illustrative purposes, we
chose the recently issued Pfizer bond, PFE 6.2% 3/15/2019. Around 3/20/2009, financing was around 200 basis points
over 3 month Libor. Assuming the specified
credit curve and financing of 200 over, the bond equivalent coupon is 6.12%. The
bond would have been issued with a coupon of 4.10% if financing was ignored. For
par bonds, both models give essentially the same results.
Zero P&L Model
Pull-to-Par Model
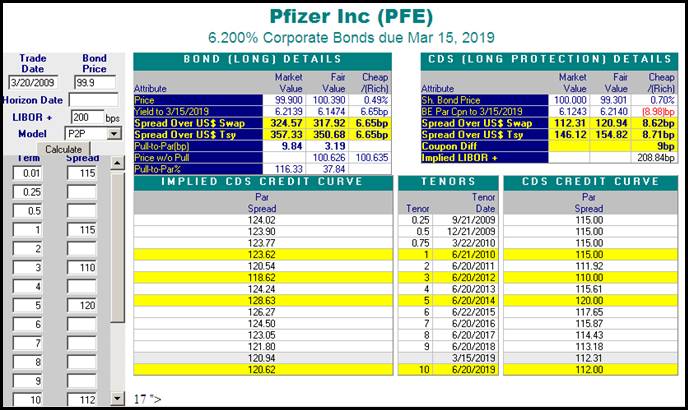
At 200 over, the bond fair
value is at a slight premium. The implied financing (209 bps over 3 month Libor)
shows what the financing assumption must be for the model price to be equal to
the market price. The implied CDS curve shows what the CDS curve would be
assuming financing of 200 over and a bond fair value equal to the market price
(flat CDS goes from 112 to 121). For outright
investors not interested in financing their positions, the new issue market is
one way to keep track of the consensus market financing level.
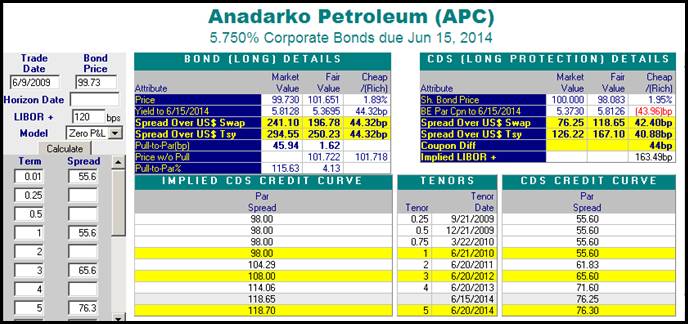
By June, financing levels
were at about 120 over. On 6/9/2009,
Anadarko Petroleum issued APC 5.75%6/15/2014 at just below par. Our analysis
suggests that the bond market and the CDS market were disconnected for this
issue. Either funding should be at about 163 over, or the CDS curve should be
wider by 42 basis points. However, by 6/11/2009, this bond was trading at 101.70 with no change
in the CDS credit curve, suggesting the market found this bond’s coupon very
attractive. If this bond had been issued with a coupon of about 5.35%-5.40%, we
believe it would have traded at par initially.
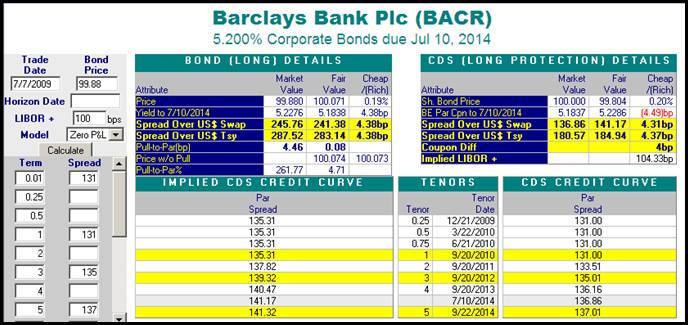
By late June and early July, financing levels had lowered
to about 100 over Libor. Barclays Bank took advantage of this with a new issue
BACR 5.2% 6/10/2014
pricing at 99.88. The implied financing of 104 over Libor is inline with the
assumed financing of 100 over Libor.
Unlike the primary market,
the secondary bond market appears to be inconsistently priced vis-à-vis the CDS
market. As might be expected in a time of investor uncertainty, high quality
credits are generally over-valued while lower quality credits are under-valued.
These pricing irregularities show up in the implied financing spread and the
implied CDS credit curve. The pricing of DIS 4.5% 12/15/2013 at around 104.10 on 6/25/2009 is an example of
a price ignoring the fundamental differences in the bond market versus the CDS
market. When an investor buys a bond, capital is used. When a broker sells a
CDS, no money is exchanged. The Kynex analytic puts these two events on an
equal footing by financing the long bond position. For both transactions, the
investor starts at zero at settlement. Even a long-only
investor must consider funding (cost of capital) when pricing bonds using CDS
market spreads. At
least theoretically,
a CDS spread is a measure of pure credit worthiness. A bond yield
compensates the buyer for the initial outlay of capital as well. On 6/25/2009, our research
suggests a financing assumption of 100bps over Libor. However, the price of
104.1 results in a spread over swaps of 71bps, 30bps below financing.
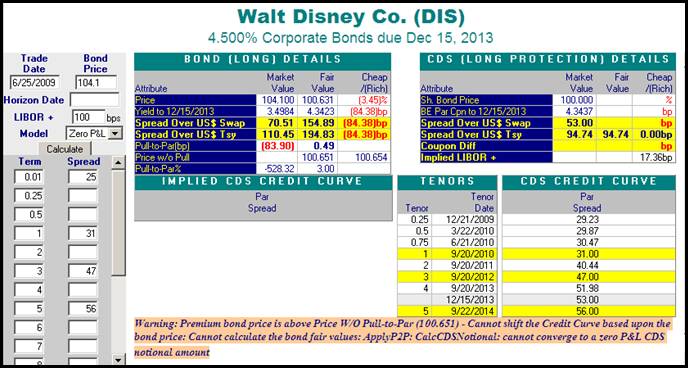
With financing included, a
par coupon of 4.34% is expected. A bond with a 4.5% coupon should be priced at
a moderate premium. Without financing included, a par coupon 100 basis points
less is expected. A model price of 104.65 (using the Pull-to-Par model)
reflects the additional coupon income over par. The market appears to be
erroneously pricing this bond by merely discounting the future flows using the
raw risk free rates and default probabilities from the CDS market (and applying
a bit of price compression).
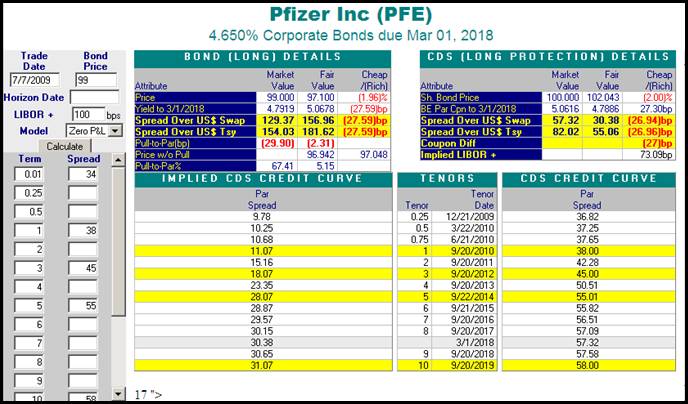
By 7/7/2009 circumstances have changed for
the Pfizer bond, PFE 6.2% 3/15/2019.
The Barclays’ new issue indicates that financing is around 100 over. Since the
issuance of PFE 6.2% 3/15/2019,
financing has dropped by 100 bps and the CDS spread has dropped by almost
55bps. 3 month Libor has dropped by almost 69bps, but the 10 year USD swap has
widened by almost 67bps. The aggregate effect of these changes is captured in
the par coupon. The par coupon has
dropped from 6.12% to 5.17%. But the yield
on this bond has dropped 131bps to 4.90%, making this bond rich when compared
to the
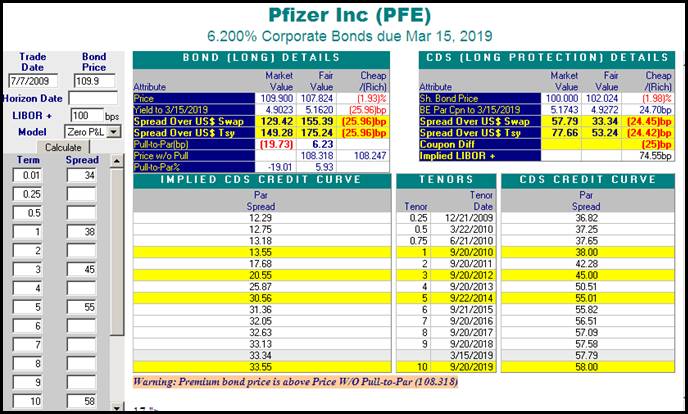
CDS market. The spread of
129bps should be troubling since the CDS spread at 3/15/2019 is around 58 and financing is
assumed to be 100 over. If this bond had
a par coupon, you would expect a spread over swaps at around 158. Other Pfizer bonds
have performed similarly in the market.
However, not every bond and
issuer was treated as favorably as Pfizer. On 5/7/2009, Dow Chemical issued DOW 8.55% 5/15/2019. The initial
pricing appeared very attractive for investors vis-à-vis the ten-year CDS quote
of 195bps.
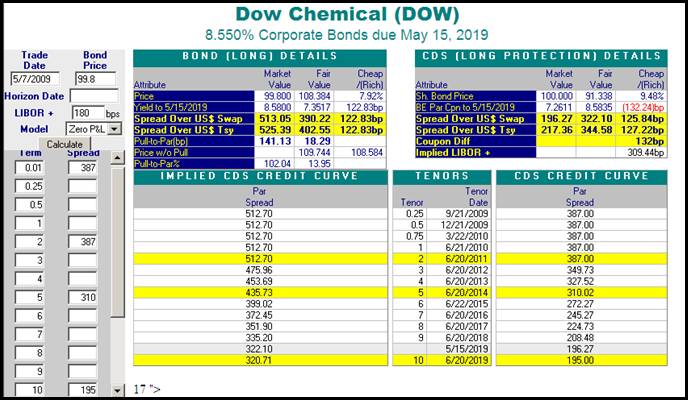
The bond market obviously
ignored the CDS market’s view of the long term credit worthiness of Dow
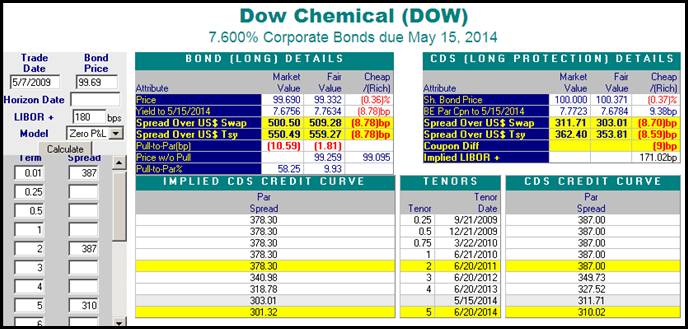
Chemical, using a spread (322bps) just higher than the 5 year CDS spread of
310. The pricing of DOW 7.6% 5/15/2014
was more inline.
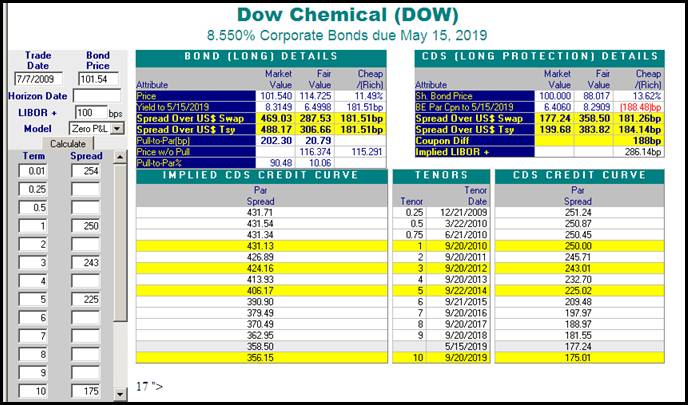
By 7/7/2009, the Dow CDS curve has improved.
But the bond market did not accept the longer term view of the CDS market for
Dow Chemical. Both bonds shown below suggest that the bond market has not
changed the long term outlook for Dow Chemical.
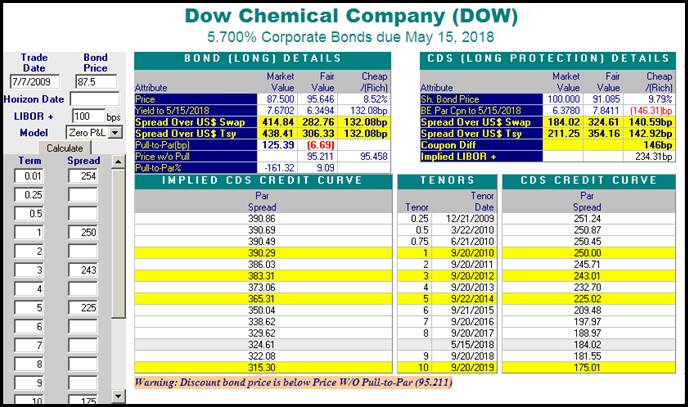
One
way the investor can take advantage of a situation like DOW 5.7% 5/15/2018 is to do a basis
trade. The investor finances the long bond position, buys CDS protection, and
enters into an interest rate swap. The difficult decision here is to determine
how much protection to buy. If no default is expected by the investor, then he
should consider light protection. Under this scenario, the investor will not bleed
deal payments, and he hopes the credit will improve enough so that the trade
can be unwound for profit or held until maturity. On 7/7/2009, if the CDS notional amount is $812,409, the
expected P&L is $120,989. But if default occurs (especially early), the
investor will experience a significant loss. This risk is expressed in a
P&L standard deviation of $53,200 (due to the timing of default). A neutral
position for the investor would be the purchase of $1,006,904 CDS protection.
The expected P&L is lower at $109,596. But this expected amount is the same
whether or not default occurs. Risk in terms of P&L deviation due to the
timing of default is $4,658. At this protection level, the standard deviation
is minimized. A detailed description of
these two alternatives can be found in the Appendix.
Appendix
Model Comparison
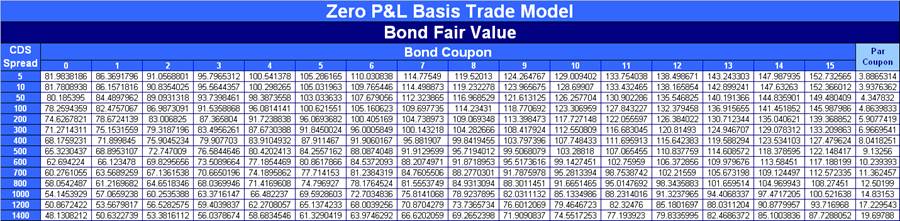
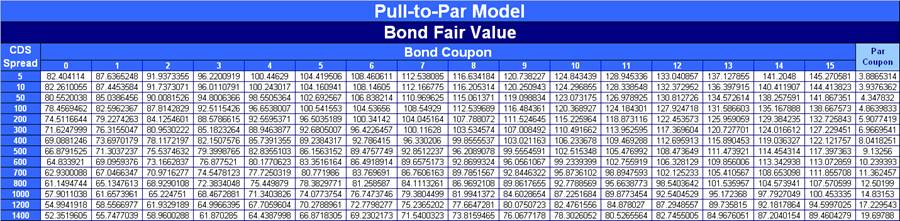
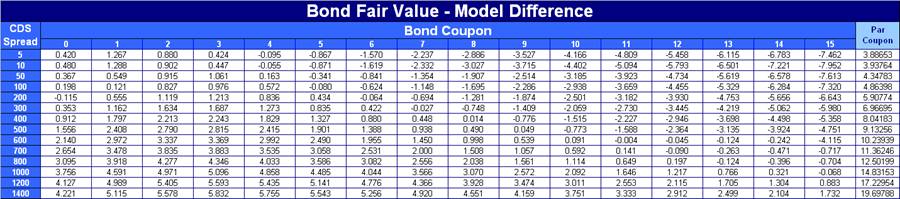
The following tables compare
model prices for a 5 year bond on 7/7/2009 using 100 over Libor for the financing
assumption. The CDS curve is assumed to be flat for every CDS spread. For
specific CDS spreads, we also graph the prices of the two models. At the par
coupon, both models (and the Price-Without-Pull-to-Par as well) return par as
the fair values. For premium bonds, the Pull-to-Par Model returns a lower price
reflecting increased risk. For discount bonds, the Pull-to-Par Model returns a
higher fair value reflecting the decreased amount of loss from any default (if
not otherwise constrained).
Anatomy of the Zero
P&L Basis Trade Model
To illustrate how the Kynex
Zero P&L Model works, we will use the Pfizer bond, PFE 6.2% 3/15/2019, priced at 109.9
on 7/7/2009. Please
refer to this example mentioned above. A premium bond will show the moving
parts of the model more than a par bond. We should initially note that the
market price of 109.9 implies a spread of around 130 (129.4 interpolated, 132.5
par spread) over swaps. This spread should be troubling since the CDS spread at
3/15/2019 is
around 58 and financing is assumed to be 100 over. If this bond had a par coupon, you would
expect a spread over swaps at around 158. Both the Zero P&L Model and the
Pull-to-Par Model first identify the par coupon with and without financing. If
par cannot be accurately identified, there is no hope of pricing a similar bond
with a lower or higher coupon. The par coupon is calculated by iteratively
constructing a basis trade with a bond whose yield must equal to the coupon.
The spread on the floating leg (ASW) of the interest rate swap is calculated to
hedge away price movements on the par bond, and the CDS notional amount is
calculated so that P&L will be zero at maturity. Since the price of the par
bond is known, the coupon is calculated. For the actual bond in question, the
coupon is known but the price is not. The model then iteratively solves for the
price (as well as the ASW and the CDS notional amount) so that P&L is once
again zero at maturity. The results of the two calculations are shown below. The CDS notional calculation is important to
maintain a low P&L standard deviation.
Therefore, the model price
should be 107.82 since the expected P&L at maturity is zero if default does
not occur, and the expected P&L is zero if default does occur. If default
does not occur, the detail for the P&L is shown below.
Although the argument for the Zero P&L model is
compelling, this example does expose a problem with bonds priced at a large
premium. The par bond yields 5.174276%,
but PFE 6.2% 3/15/2019
yields 5.162% at 107.8235. Why would an investor ever pay over 107 for a yield
of 5.16% when able to earn 5.17% on the corresponding par bond (if it existed
in the market)? This is especially true if default were to occur. The premium
bond buyer has much more to lose regardless of the recovery rate. The Kynex
Pull-to-Par Model is a yield and a risk based model, and it attempts to pull
the price on premium bonds back down to a price and up to a yield that
compensates for the additional default loss associated with premium bonds. For
this bond, the Pull-to-Par Model price is 106.387 (yielding 5.345%).
Basis Trade Using DOW 5.7% 5/15/2018
CDS Notional $812,409 vs
CDS Notional $1,006,904
All P&L values are as of 5/15/2018. The investor’s
need to possibly unwind the trade before maturity is a cause for concern when
buying $812,409 CDS protection. Consider the circumstance of default on 11/15/2011. As shown by the projection below, cumulative
P&L is negative immediately after default. The projected performance of the
IR swap (which does not disappear if default occurs) brings the investor back
to positive P&L territory.
If the investor buys
$1,006,904 CDS protection, this concern is ameliorated if default occurs on 11/15/2011.
If default never occurs, the
bleed from the deal payments and the financing can be seen when the CDS
protection is at the higher amount.
Bond Fair Values and the
Shape of the Credit Curve
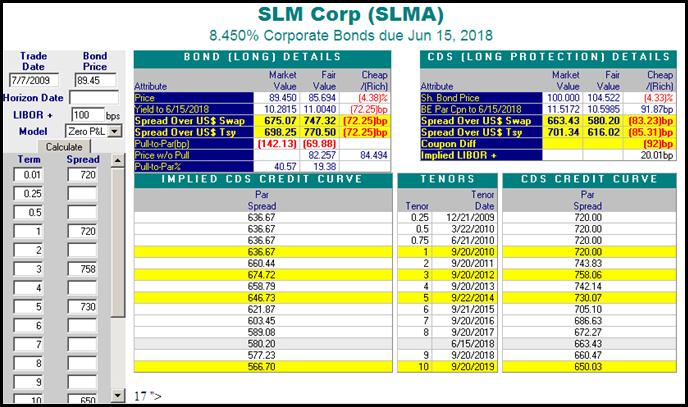
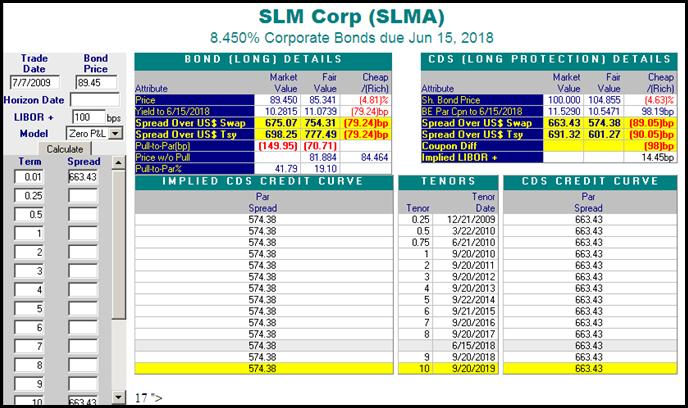
For illustrative purposes, we
chose the SLMA 8.45% 6/15/2018
bond trading on 7/7/2009.
At a price of 89.45, the market price appears to be very rich when compared to
the CDS market. We can only speculate
that financing has been ignored (fair value goes from 85.694 to 91.00).
Regardless of that, when the equivalent flat spread of 663 is used; the fair
value drops to 85.34.